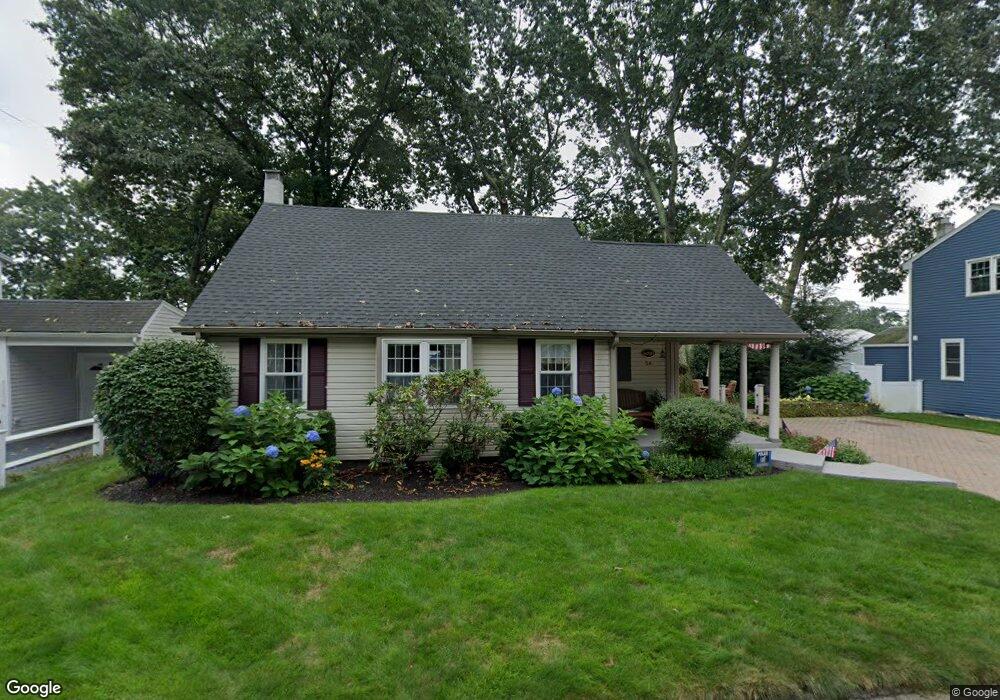
54 Cypress Rd Wrentham, MA 02093
Estimated Value: $549,607 - $609,000
3
Beds
2
Baths
1,400
Sq Ft
$408/Sq Ft
Est. Value
About This Home
This home is located at 54 Cypress Rd, Wrentham, MA 02093 and is currently estimated at $570,902, approximately $407 per square foot. 54 Cypress Rd is a home located in Norfolk County with nearby schools including Delaney Elementary School and Charles E Roderick.
Ownership History
Date
Name
Owned For
Owner Type
Purchase Details
Closed on
Nov 15, 2010
Sold by
Mccrave Jennifer G and Rosselli Jennifer G
Bought by
Mccrave Matthew J and Mccrave Jennifer G
Current Estimated Value
Home Financials for this Owner
Home Financials are based on the most recent Mortgage that was taken out on this home.
Original Mortgage
$275,500
Outstanding Balance
$183,890
Interest Rate
4.5%
Mortgage Type
FHA
Estimated Equity
$387,012
Purchase Details
Closed on
Jul 31, 2003
Sold by
Barba Michael J and Barba Janice M
Bought by
Rosselli Jennifer G and Mccrave Matthew J
Home Financials for this Owner
Home Financials are based on the most recent Mortgage that was taken out on this home.
Original Mortgage
$264,720
Interest Rate
5.28%
Mortgage Type
Purchase Money Mortgage
Create a Home Valuation Report for This Property
The Home Valuation Report is an in-depth analysis detailing your home's value as well as a comparison with similar homes in the area
Home Values in the Area
Average Home Value in this Area
Purchase History
| Date | Buyer | Sale Price | Title Company |
|---|---|---|---|
| Mccrave Matthew J | -- | -- | |
| Rosselli Jennifer G | $330,900 | -- |
Source: Public Records
Mortgage History
| Date | Status | Borrower | Loan Amount |
|---|---|---|---|
| Open | Mccrave Matthew J | $275,500 | |
| Previous Owner | Rosselli Jennifer G | $264,720 |
Source: Public Records
Tax History Compared to Growth
Tax History
| Year | Tax Paid | Tax Assessment Tax Assessment Total Assessment is a certain percentage of the fair market value that is determined by local assessors to be the total taxable value of land and additions on the property. | Land | Improvement |
|---|---|---|---|---|
| 2025 | $5,379 | $464,100 | $232,900 | $231,200 |
| 2024 | $5,155 | $429,600 | $232,900 | $196,700 |
| 2023 | $4,918 | $389,700 | $211,700 | $178,000 |
| 2022 | $4,861 | $355,600 | $206,000 | $149,600 |
| 2021 | $4,708 | $334,600 | $192,500 | $142,100 |
| 2020 | $4,359 | $305,900 | $146,900 | $159,000 |
| 2019 | $3,997 | $283,100 | $132,200 | $150,900 |
| 2018 | $3,747 | $263,100 | $132,300 | $130,800 |
| 2017 | $3,544 | $248,700 | $129,800 | $118,900 |
| 2016 | $3,464 | $242,600 | $126,000 | $116,600 |
| 2015 | $3,549 | $236,900 | $134,600 | $102,300 |
| 2014 | $3,602 | $235,300 | $129,500 | $105,800 |
Source: Public Records
Map
Nearby Homes
- 246 Forest Grove Ave
- 3 Oak Rd
- 0 W Birch Rd
- 10 W Birch Rd
- 270 Dedham St
- 45 King St
- 1 Lorraine Metcalf Dr
- 45 Joshua Rd
- 3 Sparrow Rd
- 38 Robin Rd
- 2 Diamond St
- 50 Reed Fulton Ave Unit Lot 61
- 11 Quail Run Rd
- 10 Nature View Dr
- 15 Nature View Dr
- 3 Pheasanthill Rd
- 71 Pond St
- 570 Franklin St
- 362 East St
- 14 Essex St
- 58 Cypress Rd
- 333 Shears St
- 48 Cypress Rd
- 53 Cypress Rd
- 325 Shears St
- 63 Cypress Rd
- 63 Cypress Rd
- 335 Shears St
- 59 Cypress Rd
- 49 Cypress Rd
- 71 Cypress Rd
- 337 Shears St
- 337 Shears St Unit 1
- 337 Shears St Unit 337
- 39 Cypress Rd
- 90 Cypress Rd
- 90 Cypress Rd Unit 1`
- 90 Cypress Rd Unit 2
- 90 Cypress Rd Unit 90
- 339 Shears St