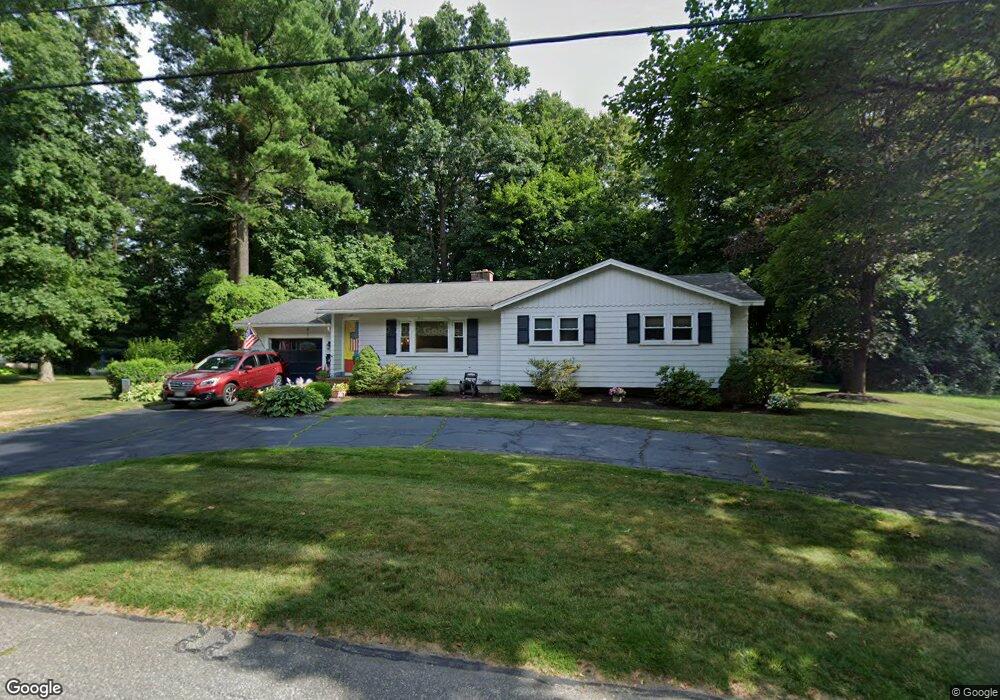
54 Dean Rd Wayland, MA 01778
Estimated Value: $678,000 - $907,000
3
Beds
2
Baths
1,192
Sq Ft
$635/Sq Ft
Est. Value
About This Home
This home is located at 54 Dean Rd, Wayland, MA 01778 and is currently estimated at $757,347, approximately $635 per square foot. 54 Dean Rd is a home located in Middlesex County with nearby schools including Wayland High School, Veritas Christian Academy, and The Rivers School.
Ownership History
Date
Name
Owned For
Owner Type
Purchase Details
Closed on
May 11, 1988
Sold by
Tavitian Vartan D
Bought by
Dena Rt
Current Estimated Value
Home Financials for this Owner
Home Financials are based on the most recent Mortgage that was taken out on this home.
Original Mortgage
$162,000
Interest Rate
10.02%
Mortgage Type
Purchase Money Mortgage
Create a Home Valuation Report for This Property
The Home Valuation Report is an in-depth analysis detailing your home's value as well as a comparison with similar homes in the area
Home Values in the Area
Average Home Value in this Area
Purchase History
| Date | Buyer | Sale Price | Title Company |
|---|---|---|---|
| Dena Rt | $202,500 | -- |
Source: Public Records
Mortgage History
| Date | Status | Borrower | Loan Amount |
|---|---|---|---|
| Open | Dena Rt | $225,000 | |
| Closed | Dena Rt | $150,000 | |
| Closed | Dena Rt | $162,000 |
Source: Public Records
Tax History
| Year | Tax Paid | Tax Assessment Tax Assessment Total Assessment is a certain percentage of the fair market value that is determined by local assessors to be the total taxable value of land and additions on the property. | Land | Improvement |
|---|---|---|---|---|
| 2025 | $9,422 | $602,800 | $344,500 | $258,300 |
| 2024 | $8,913 | $574,300 | $328,000 | $246,300 |
| 2023 | $8,645 | $519,200 | $298,200 | $221,000 |
| 2022 | $7,806 | $425,400 | $247,000 | $178,400 |
| 2021 | $12,912 | $401,500 | $224,500 | $177,000 |
| 2020 | $8,766 | $401,500 | $224,500 | $177,000 |
| 2019 | $7,122 | $389,600 | $243,700 | $145,900 |
| 2018 | $5,615 | $368,300 | $243,700 | $124,600 |
| 2017 | $6,469 | $356,600 | $232,000 | $124,600 |
| 2016 | $6,277 | $362,000 | $227,500 | $134,500 |
| 2015 | $6,571 | $357,300 | $227,500 | $129,800 |
Source: Public Records
Map
Nearby Homes
- 5 Haven Ln
- 8 Liberty St
- 201 Willow Brook Dr
- 340 N Main St
- 29 Irving Rd
- 5 Bradford Rd
- 4 Richard Rd
- 1 Richard Rd
- 25 Irving Rd
- 136 Commonwealth Rd
- 50 Wethersfield Rd
- 186 Main St
- 45 W Plain St Unit 1
- 278 N Main St
- 37 Longfellow Rd
- 13 Shawmut Avenue Extension
- 6 Ash St
- 5 Griffin Cir
- 6 Briar Ln
- 26 Longfellow Rd
Your Personal Tour Guide
Ask me questions while you tour the home.