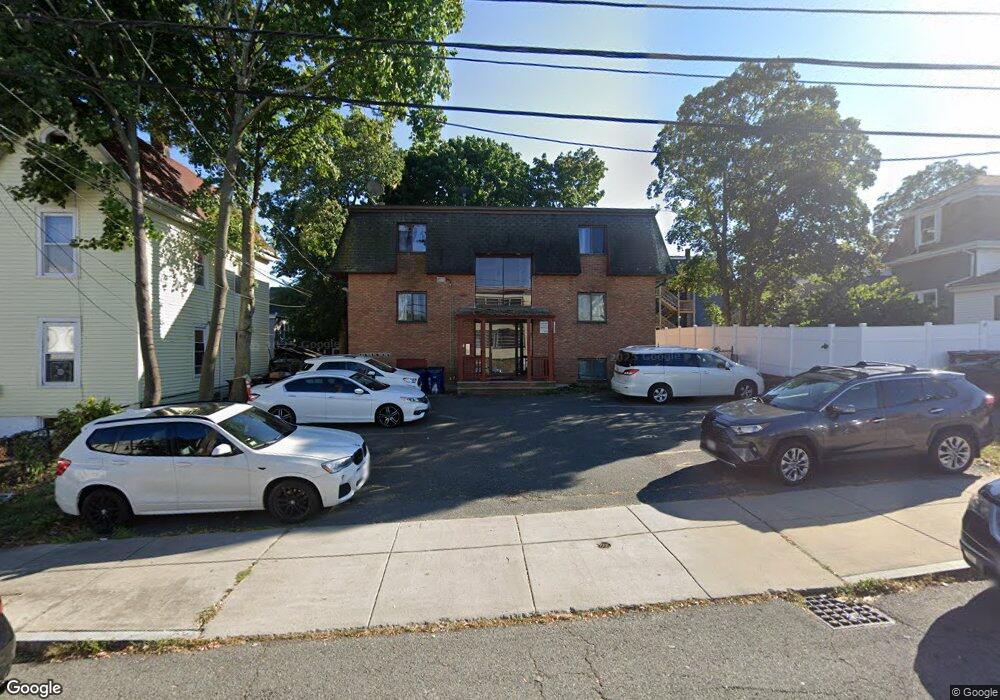
54 Dehon St Revere, MA 02151
Crescent Beach NeighborhoodEstimated Value: $1,327,225
11
Beds
6
Baths
5,700
Sq Ft
$233/Sq Ft
Est. Value
About This Home
This home is located at 54 Dehon St, Revere, MA 02151 and is currently estimated at $1,327,225, approximately $232 per square foot. 54 Dehon St is a home located in Suffolk County with nearby schools including Garfield Elementary School, Garfield Middle School, and Rumney Marsh Academy.
Ownership History
Date
Name
Owned For
Owner Type
Purchase Details
Closed on
Aug 17, 2023
Sold by
Beckert Roger P
Bought by
54 Dehon Street Llc
Current Estimated Value
Purchase Details
Closed on
Jul 13, 2000
Sold by
Shi Bin and Fu Hongning
Bought by
Beckert Roger P
Home Financials for this Owner
Home Financials are based on the most recent Mortgage that was taken out on this home.
Original Mortgage
$75,000
Interest Rate
8.5%
Mortgage Type
Commercial
Purchase Details
Closed on
Jun 24, 1999
Sold by
Rockingham Corp
Bought by
Shi Bin and Fu Hongning
Home Financials for this Owner
Home Financials are based on the most recent Mortgage that was taken out on this home.
Original Mortgage
$216,000
Interest Rate
7.09%
Mortgage Type
Commercial
Purchase Details
Closed on
Jun 4, 1998
Sold by
Dehon St Rt and Giardullo
Bought by
Rockingham Corp
Create a Home Valuation Report for This Property
The Home Valuation Report is an in-depth analysis detailing your home's value as well as a comparison with similar homes in the area
Home Values in the Area
Average Home Value in this Area
Purchase History
| Date | Buyer | Sale Price | Title Company |
|---|---|---|---|
| 54 Dehon Street Llc | -- | None Available | |
| 54 Dehon Street Llc | -- | None Available | |
| 54 Dehon Street Llc | -- | None Available | |
| Beckert Roger P | $375,000 | -- | |
| Beckert Roger P | $375,000 | -- | |
| Shi Bin | $270,000 | -- | |
| Shi Bin | $270,000 | -- | |
| Rockingham Corp | $229,000 | -- | |
| Rockingham Corp | $229,000 | -- |
Source: Public Records
Mortgage History
| Date | Status | Borrower | Loan Amount |
|---|---|---|---|
| Previous Owner | Rockingham Corp | $75,000 | |
| Previous Owner | Rockingham Corp | $216,000 |
Source: Public Records
Tax History Compared to Growth
Tax History
| Year | Tax Paid | Tax Assessment Tax Assessment Total Assessment is a certain percentage of the fair market value that is determined by local assessors to be the total taxable value of land and additions on the property. | Land | Improvement |
|---|---|---|---|---|
| 2025 | $10,432 | $1,150,200 | $267,900 | $882,300 |
| 2024 | $9,931 | $1,090,100 | $235,400 | $854,700 |
| 2023 | $9,550 | $1,004,200 | $204,600 | $799,600 |
| 2022 | $9,207 | $885,300 | $194,800 | $690,500 |
| 2021 | $8,472 | $766,000 | $178,600 | $587,400 |
| 2020 | $8,215 | $729,600 | $162,400 | $567,200 |
| 2019 | $7,479 | $617,600 | $146,100 | $471,500 |
| 2018 | $7,172 | $553,400 | $120,100 | $433,300 |
| 2017 | $6,980 | $498,900 | $103,900 | $395,000 |
| 2016 | $5,815 | $402,400 | $94,200 | $308,200 |
| 2015 | $5,956 | $402,400 | $94,200 | $308,200 |
Source: Public Records
Map
Nearby Homes
- 83 Shirley Ave
- 6 Garfield Ave
- 74 Garfield Ave
- 71 Revere Beach Blvd Unit 11
- 43 Kimball Ave Unit 2
- 37 Franklin Ave
- 10 Franklin Ave Unit 403
- 10 Franklin Ave Unit G10
- 10 Franklin Ave Unit 404
- 10 Franklin Ave Unit 402
- 10 Franklin Ave Unit 107
- 376 Ocean Ave Unit 706
- 376 Ocean Ave Unit 709
- 376 Ocean Ave Unit 1615
- 419 Lee Burbank Hwy
- 10 Ocean Ave Unit 213
- 95 Harris St
- 127 Atlantic Ave Unit 4
- 224 Harris St
- 16 Wave Ave
- 48 Dehon St
- 60 Dehon St
- 62 Dehon St
- 62 Dehon St Unit 2
- 44 Dehon St
- 24 Fitzhenry Square
- 18 Fitzhenry Square Unit 12
- 18 Fitzhenry Square Unit 11
- 18 Fitzhenry Square Unit 7
- 18 Fitzhenry Square Unit 8
- 18 Fitzhenry Square Unit 2
- 18 Fitzhenry Square Unit 3
- 34 Fitzhenry Square
- 64 Dehon St
- 40 Dehon St
- 30 Fitzhenry Square
- 53 Dehon St Unit 2
- 47 Dehon St
- 59 Dehon St
- 72 Centennial Ave