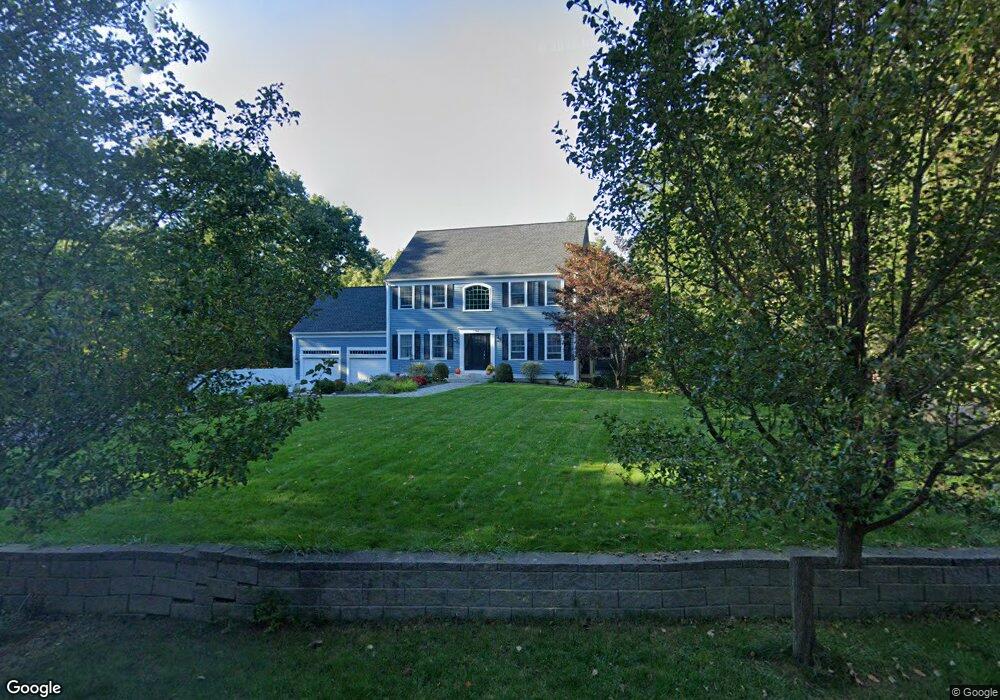
54 Elm St Byfield, MA 01922
Estimated Value: $965,434 - $1,059,000
4
Beds
3
Baths
2,818
Sq Ft
$364/Sq Ft
Est. Value
About This Home
This home is located at 54 Elm St, Byfield, MA 01922 and is currently estimated at $1,025,109, approximately $363 per square foot. 54 Elm St is a home located in Essex County with nearby schools including Triton Regional High School, North Shore Montessori School, and Clark School.
Ownership History
Date
Name
Owned For
Owner Type
Purchase Details
Closed on
May 8, 2020
Sold by
Olson Mark and Olson Patricia
Bought by
Olson 2020 Nt
Current Estimated Value
Purchase Details
Closed on
Dec 18, 2000
Sold by
Miles Shawn M and Miles Cathryn B
Bought by
Olson Mark and Olson Patricia
Purchase Details
Closed on
Oct 12, 1999
Sold by
Eagle Bldg Co Inc
Bought by
Miles Shawn M and Miles Cathryn B
Create a Home Valuation Report for This Property
The Home Valuation Report is an in-depth analysis detailing your home's value as well as a comparison with similar homes in the area
Home Values in the Area
Average Home Value in this Area
Purchase History
| Date | Buyer | Sale Price | Title Company |
|---|---|---|---|
| Olson 2020 Nt | -- | None Available | |
| Olson 2020 Nt | -- | None Available | |
| Olson 2020 Nt | -- | None Available | |
| Olson Mark | $410,000 | -- | |
| Olson Mark | $410,000 | -- | |
| Miles Shawn M | $341,950 | -- | |
| Miles Shawn M | $341,950 | -- |
Source: Public Records
Mortgage History
| Date | Status | Borrower | Loan Amount |
|---|---|---|---|
| Previous Owner | Miles Shawn M | $205,000 | |
| Previous Owner | Miles Shawn M | $150,000 |
Source: Public Records
Tax History Compared to Growth
Tax History
| Year | Tax Paid | Tax Assessment Tax Assessment Total Assessment is a certain percentage of the fair market value that is determined by local assessors to be the total taxable value of land and additions on the property. | Land | Improvement |
|---|---|---|---|---|
| 2025 | $6,341 | $851,100 | $322,800 | $528,300 |
| 2024 | $6,331 | $824,400 | $322,800 | $501,600 |
| 2023 | $6,596 | $760,800 | $301,300 | $459,500 |
| 2022 | $6,437 | $661,600 | $258,300 | $403,300 |
| 2021 | $6,303 | $591,300 | $215,200 | $376,100 |
| 2020 | $6,340 | $576,900 | $215,200 | $361,700 |
| 2019 | $6,236 | $576,900 | $215,200 | $361,700 |
| 2018 | $5,967 | $547,400 | $208,800 | $338,600 |
| 2017 | $5,686 | $535,900 | $208,800 | $327,100 |
| 2016 | $5,773 | $506,400 | $193,700 | $312,700 |
| 2015 | $5,338 | $463,400 | $150,700 | $312,700 |
| 2014 | $5,123 | $452,600 | $139,900 | $312,700 |
Source: Public Records
Map
Nearby Homes
- 78 Elm St
- 36 Caldwell Farm Rd
- 64 Caldwell Farm Rd Unit 64
- 4 Coleman Rd
- 601 Newburyport Turnpike
- 15 School St
- 254 Middle Rd
- 103 Central St
- 1 Osprey Ct
- Lot 4 Osprey Ct
- Lot 3 Osprey Ct
- 304 & 480 Wethersfield St & Nbpt Tnpk
- 304-312 Wethersfield St
- 308 & 312 Wethersfield St
- 66 3 Parish Rd
- 66 2 Parish Rd
- 460-472 Newburyport Turnpike
- 55 Pearson Dr Unit 9 - ALDER
- 55 Pearson Dr Unit 6-Dogwood
- 55 Pearson Dr Unit 3 - ALDER