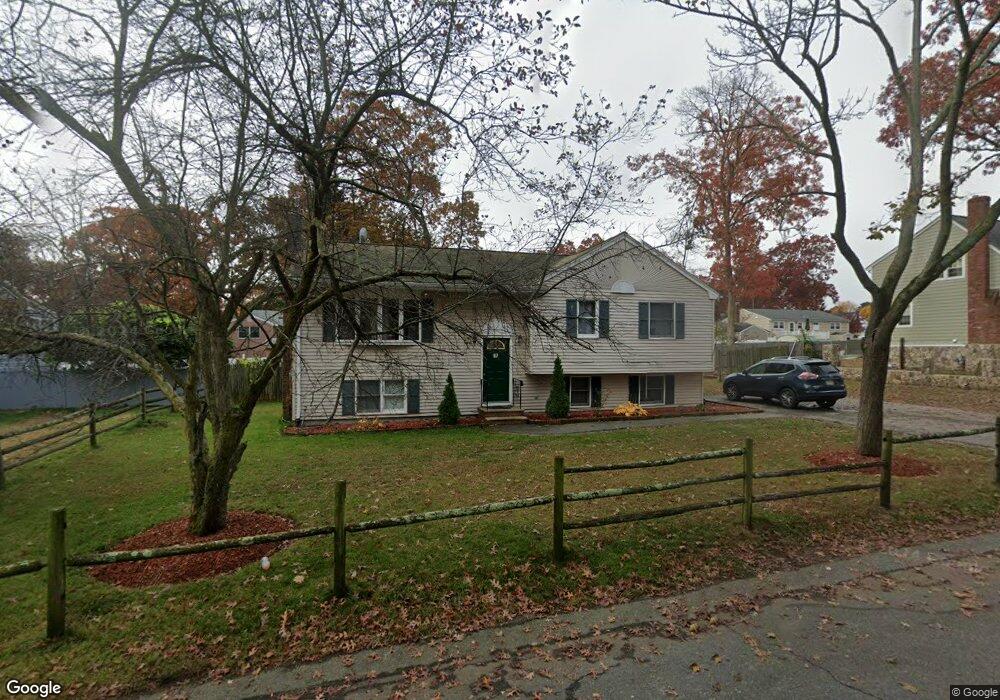
54 Emeline St Randolph, MA 02368
North Randolph NeighborhoodEstimated Value: $570,561 - $605,000
3
Beds
3
Baths
1,186
Sq Ft
$497/Sq Ft
Est. Value
About This Home
This home is located at 54 Emeline St, Randolph, MA 02368 and is currently estimated at $589,140, approximately $496 per square foot. 54 Emeline St is a home located in Norfolk County with nearby schools including Randolph High School and Thayer Academy.
Ownership History
Date
Name
Owned For
Owner Type
Purchase Details
Closed on
Jan 14, 2005
Sold by
Melendy James W
Bought by
Francois Juslene
Current Estimated Value
Home Financials for this Owner
Home Financials are based on the most recent Mortgage that was taken out on this home.
Original Mortgage
$284,800
Outstanding Balance
$144,361
Interest Rate
5.81%
Mortgage Type
Purchase Money Mortgage
Estimated Equity
$444,779
Create a Home Valuation Report for This Property
The Home Valuation Report is an in-depth analysis detailing your home's value as well as a comparison with similar homes in the area
Home Values in the Area
Average Home Value in this Area
Purchase History
| Date | Buyer | Sale Price | Title Company |
|---|---|---|---|
| Francois Juslene | $356,000 | -- |
Source: Public Records
Mortgage History
| Date | Status | Borrower | Loan Amount |
|---|---|---|---|
| Open | Francois Juslene | $284,800 |
Source: Public Records
Tax History Compared to Growth
Tax History
| Year | Tax Paid | Tax Assessment Tax Assessment Total Assessment is a certain percentage of the fair market value that is determined by local assessors to be the total taxable value of land and additions on the property. | Land | Improvement |
|---|---|---|---|---|
| 2025 | $5,956 | $513,000 | $221,800 | $291,200 |
| 2024 | $5,838 | $509,900 | $217,500 | $292,400 |
| 2023 | $5,534 | $458,100 | $197,700 | $260,400 |
| 2022 | $5,328 | $391,800 | $164,700 | $227,100 |
| 2021 | $5,115 | $346,100 | $137,300 | $208,800 |
| 2020 | $4,977 | $333,800 | $137,300 | $196,500 |
| 2019 | $4,903 | $327,300 | $130,800 | $196,500 |
| 2018 | $4,662 | $293,600 | $118,800 | $174,800 |
| 2017 | $4,373 | $270,300 | $110,900 | $159,400 |
| 2016 | $4,250 | $244,400 | $100,800 | $143,600 |
| 2015 | $4,292 | $237,100 | $96,000 | $141,100 |
Source: Public Records
Map
Nearby Homes
- 23 Emeline St
- 304 High St
- 10 Michael Rd
- 11 Royal Crest Dr Unit 5
- 9 Royal Crest Dr Unit 12
- 1277 N Main St
- 11 Rockefeller St
- 33 Michael Rd
- 232 Canton St Unit 104
- 232 Canton St Unit 112
- 902 Irving Rd Unit 902
- 12 Webster St
- 7 Webster St
- 229 Chestnut St
- 172 Russ St
- 26 Knights Crescent St
- 2 Smith Rd
- 34 Orchard St
- 1 Clark Cir
- 79 Gold St