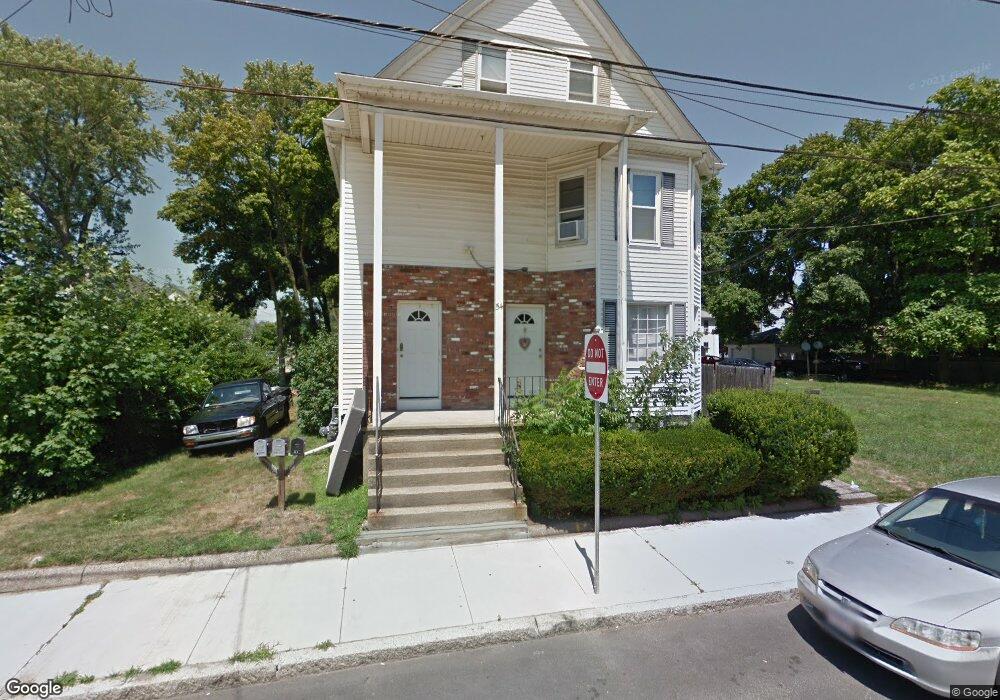
54 Emory St Unit 1 Attleboro, MA 02703
Estimated Value: $633,767 - $688,000
2
Beds
2
Baths
2,742
Sq Ft
$243/Sq Ft
Est. Value
About This Home
This home is located at 54 Emory St Unit 1, Attleboro, MA 02703 and is currently estimated at $667,192, approximately $243 per square foot. 54 Emory St Unit 1 is a home located in Bristol County with nearby schools including Hyman Fine Elementary School, Wamsutta Middle School, and Attleboro High School.
Ownership History
Date
Name
Owned For
Owner Type
Purchase Details
Closed on
Nov 19, 2021
Sold by
Bayridge Realty Llc
Bought by
Mercado Andres F
Current Estimated Value
Home Financials for this Owner
Home Financials are based on the most recent Mortgage that was taken out on this home.
Original Mortgage
$495,853
Outstanding Balance
$454,364
Interest Rate
2.99%
Mortgage Type
FHA
Estimated Equity
$212,828
Purchase Details
Closed on
Jul 23, 2013
Sold by
Gale Matthew B
Bought by
Bayridge Realty Llc
Purchase Details
Closed on
Jan 31, 2011
Sold by
John F Friedman Rt
Bought by
Gale Matthew B
Create a Home Valuation Report for This Property
The Home Valuation Report is an in-depth analysis detailing your home's value as well as a comparison with similar homes in the area
Home Values in the Area
Average Home Value in this Area
Purchase History
| Date | Buyer | Sale Price | Title Company |
|---|---|---|---|
| Mercado Andres F | $505,000 | None Available | |
| Bayridge Realty Llc | $230,000 | -- | |
| Gale Matthew B | $162,500 | -- |
Source: Public Records
Mortgage History
| Date | Status | Borrower | Loan Amount |
|---|---|---|---|
| Open | Mercado Andres F | $495,853 |
Source: Public Records
Tax History Compared to Growth
Tax History
| Year | Tax Paid | Tax Assessment Tax Assessment Total Assessment is a certain percentage of the fair market value that is determined by local assessors to be the total taxable value of land and additions on the property. | Land | Improvement |
|---|---|---|---|---|
| 2025 | $7,612 | $606,500 | $124,900 | $481,600 |
| 2024 | $7,315 | $574,600 | $124,900 | $449,700 |
| 2023 | $6,443 | $470,600 | $113,500 | $357,100 |
| 2022 | $5,310 | $367,500 | $108,000 | $259,500 |
| 2021 | $5,122 | $346,100 | $103,900 | $242,200 |
| 2020 | $4,787 | $328,800 | $101,000 | $227,800 |
| 2019 | $4,521 | $319,300 | $99,100 | $220,200 |
| 2018 | $4,126 | $278,400 | $96,100 | $182,300 |
| 2017 | $4,091 | $281,200 | $96,100 | $185,100 |
| 2016 | $3,684 | $248,600 | $89,800 | $158,800 |
| 2015 | $3,460 | $235,200 | $89,800 | $145,400 |
| 2014 | $3,187 | $214,600 | $85,000 | $129,600 |
Source: Public Records
Map
Nearby Homes