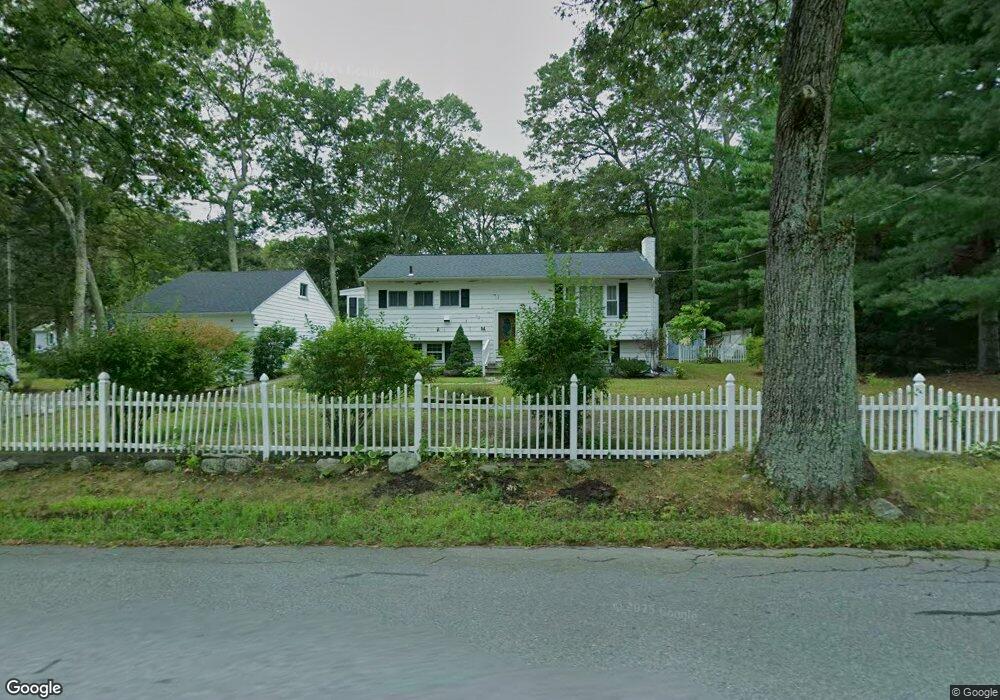
54 Fales Rd North Attleboro, MA 02760
North Attleboro NeighborhoodEstimated Value: $473,688 - $538,000
3
Beds
2
Baths
1,066
Sq Ft
$474/Sq Ft
Est. Value
About This Home
This home is located at 54 Fales Rd, North Attleboro, MA 02760 and is currently estimated at $505,422, approximately $474 per square foot. 54 Fales Rd is a home located in Bristol County with nearby schools including North Attleboro High School and Mercymount Country Day School.
Ownership History
Date
Name
Owned For
Owner Type
Purchase Details
Closed on
Oct 7, 2016
Sold by
Norrad Adam
Bought by
Norrard Adam and Norrad Catherine A
Current Estimated Value
Purchase Details
Closed on
Oct 19, 2012
Sold by
Degnim Catherine A and Degnim Stephen V
Bought by
Norrad Adam
Home Financials for this Owner
Home Financials are based on the most recent Mortgage that was taken out on this home.
Original Mortgage
$140,000
Interest Rate
3.57%
Mortgage Type
New Conventional
Create a Home Valuation Report for This Property
The Home Valuation Report is an in-depth analysis detailing your home's value as well as a comparison with similar homes in the area
Home Values in the Area
Average Home Value in this Area
Purchase History
| Date | Buyer | Sale Price | Title Company |
|---|---|---|---|
| Norrard Adam | -- | -- | |
| Norrad Adam | $150,000 | -- | |
| Norrad Adam | $150,000 | -- |
Source: Public Records
Mortgage History
| Date | Status | Borrower | Loan Amount |
|---|---|---|---|
| Previous Owner | Norrad Adam | $140,000 |
Source: Public Records
Tax History Compared to Growth
Tax History
| Year | Tax Paid | Tax Assessment Tax Assessment Total Assessment is a certain percentage of the fair market value that is determined by local assessors to be the total taxable value of land and additions on the property. | Land | Improvement |
|---|---|---|---|---|
| 2025 | $4,616 | $391,500 | $128,600 | $262,900 |
| 2024 | $4,416 | $382,700 | $128,600 | $254,100 |
| 2023 | $4,505 | $352,200 | $128,600 | $223,600 |
| 2022 | $4,380 | $314,400 | $128,600 | $185,800 |
| 2021 | $4,113 | $288,200 | $128,600 | $159,600 |
| 2020 | $55 | $279,900 | $128,600 | $151,300 |
| 2019 | $3,819 | $268,200 | $116,900 | $151,300 |
| 2018 | $58 | $256,400 | $116,900 | $139,500 |
| 2017 | $55 | $248,100 | $116,900 | $131,200 |
| 2016 | $3,350 | $253,400 | $129,800 | $123,600 |
| 2015 | $3,227 | $245,600 | $136,200 | $109,400 |
| 2014 | $3,084 | $232,900 | $126,000 | $106,900 |
Source: Public Records
Map
Nearby Homes
- 41 Stone Ridge Rd
- 34 Stone Ridge Rd
- 740 Allen Ave
- 12 Intervale Dr
- 30 Sperry Ln Unit Lot 15
- 0 Anawan Rd
- 160 Crescent Ave
- 22 Gilbert Ct
- 44 Powder Horn Way
- 46 Westside Ave
- 25 Gregory Way
- 49 Hoppin Hill Ave
- 16 Wollen Dr
- 16 Johnson St
- 50 Metcalf Rd
- 80 Broadway Unit 9
- 12 Roosevelt Ave
- 710 Nate Whipple Hwy
- 181 Paine Rd
- 12 Morgan Way Unit 1