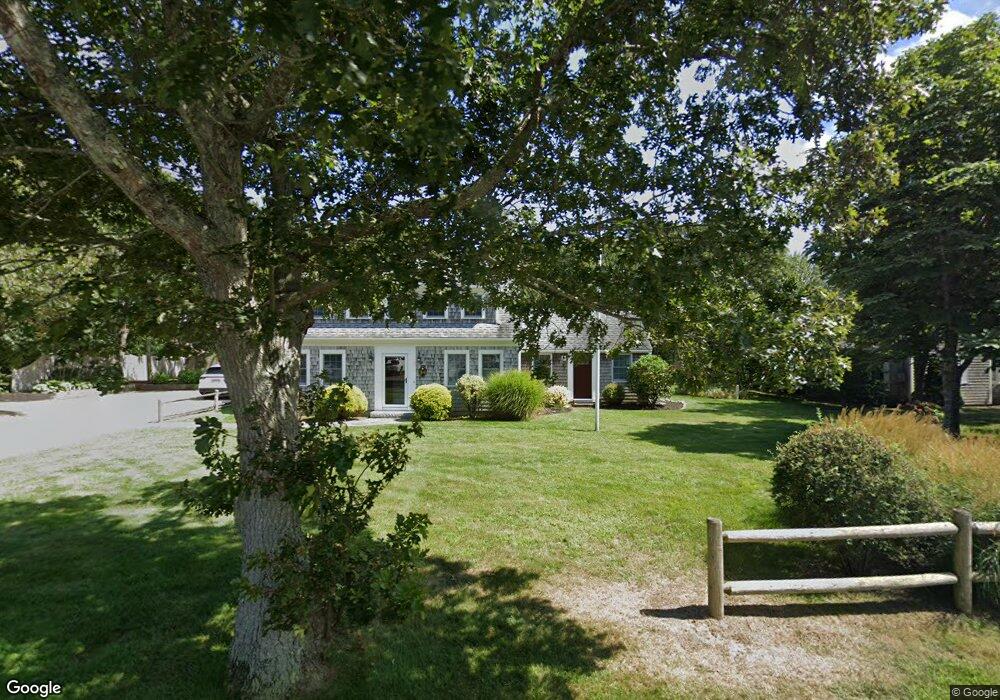
54 Fenway Rd Dennis Port, MA 02639
Dennis Port NeighborhoodEstimated Value: $830,000 - $1,064,000
4
Beds
2
Baths
1,946
Sq Ft
$480/Sq Ft
Est. Value
About This Home
This home is located at 54 Fenway Rd, Dennis Port, MA 02639 and is currently estimated at $934,531, approximately $480 per square foot. 54 Fenway Rd is a home located in Barnstable County with nearby schools including Dennis-Yarmouth Regional High School and St. Pius X. School.
Ownership History
Date
Name
Owned For
Owner Type
Purchase Details
Closed on
Apr 5, 2024
Sold by
Roller Andrea D and Roller Brian W
Bought by
Andrea D Roller Lt and Roller
Current Estimated Value
Create a Home Valuation Report for This Property
The Home Valuation Report is an in-depth analysis detailing your home's value as well as a comparison with similar homes in the area
Home Values in the Area
Average Home Value in this Area
Purchase History
| Date | Buyer | Sale Price | Title Company |
|---|---|---|---|
| Andrea D Roller Lt | -- | None Available | |
| Andrea D Roller Lt | -- | None Available |
Source: Public Records
Tax History Compared to Growth
Tax History
| Year | Tax Paid | Tax Assessment Tax Assessment Total Assessment is a certain percentage of the fair market value that is determined by local assessors to be the total taxable value of land and additions on the property. | Land | Improvement |
|---|---|---|---|---|
| 2025 | $3,831 | $884,700 | $355,900 | $528,800 |
| 2024 | $3,767 | $858,000 | $342,200 | $515,800 |
| 2023 | $3,670 | $785,900 | $311,100 | $474,800 |
| 2022 | $3,316 | $592,100 | $245,200 | $346,900 |
| 2021 | $3,108 | $515,500 | $240,400 | $275,100 |
| 2020 | $3,068 | $503,000 | $240,400 | $262,600 |
| 2019 | $3,040 | $492,700 | $255,900 | $236,800 |
| 2018 | $2,996 | $472,500 | $243,600 | $228,900 |
| 2017 | $2,788 | $453,300 | $224,400 | $228,900 |
| 2016 | $2,655 | $406,600 | $211,600 | $195,000 |
| 2015 | $2,602 | $406,600 | $211,600 | $195,000 |
| 2014 | $2,461 | $387,600 | $198,700 | $188,900 |
Source: Public Records
Map
Nearby Homes
- 22 Ferncliff Rd
- 102 Sea St
- 37-A Beach Hills Rd
- 402 Old Wharf Rd
- 402 Old Wharf Rd
- 37 Beach Hills Rd
- 405 Old Wharf Rd Unit B204
- 405 Old Wharf Rd Unit B204
- 262 Old Wharf Rd Unit 67
- 262 Old Wharf Rd Unit 5
- 262 Old Wharf Rd Unit 5
- 262 Old Wharf Rd Unit 20
- 262 Old Wharf Rd Unit 87
- 11 Ocean Park W
- 9 Chase Ave Unit 6
- 241 Old Wharf Rd Unit 82
- 241 Old Wharf Rd Unit 127
- 241 Old Wharf Rd Unit 90
- 12 Cross St
- 31 Easy St
- 50 Fenway Rd
- 17 Drury Ln
- 61 Fenway Rd
- 57 Fenway Rd Extension
- 57 Fenway Rd
- 57 Fenway Ext Rd
- 57 Fenway Extension Rd
- 53 Fenway Rd
- 26 Drury Ln
- 46 Fenway Rd
- 38 Arbor Way Unit 40
- 38 Arbor Way Unit 40
- 38 Arbor Way Unit 40
- 38 Arbor Way Unit 40
- 38 Arbor Way Unit 40
- 38 Arbor Way Unit 40
- 38 Arbor Way Unit 10A
- 38 Arbor Way Unit 8
- 38 Arbor Way Unit 1
- 38 Arbor Way Unit 3