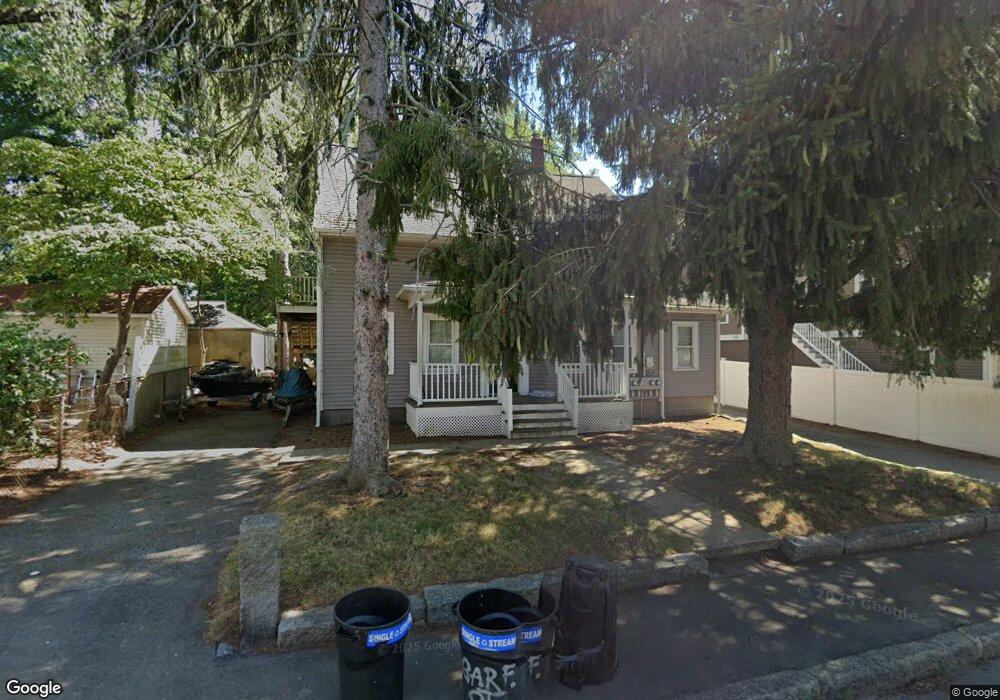
54 Garfield St Unit 2 Quincy, MA 02169
South Quincy NeighborhoodEstimated Value: $880,000 - $935,000
2
Beds
1
Bath
850
Sq Ft
$1,066/Sq Ft
Est. Value
About This Home
This home is located at 54 Garfield St Unit 2, Quincy, MA 02169 and is currently estimated at $905,867, approximately $1,065 per square foot. 54 Garfield St Unit 2 is a home located in Norfolk County with nearby schools including Lincoln-Hancock Community School, South West Middle School, and Quincy High School.
Ownership History
Date
Name
Owned For
Owner Type
Purchase Details
Closed on
Mar 7, 2008
Sold by
Barry Laura J and Barry William T
Bought by
Coleman Agnes M and Coleman Michael A
Current Estimated Value
Purchase Details
Closed on
Jul 11, 2002
Sold by
Griffin Henry C Est
Bought by
Barry William T and Barry Laura J
Home Financials for this Owner
Home Financials are based on the most recent Mortgage that was taken out on this home.
Original Mortgage
$205,000
Interest Rate
6.79%
Mortgage Type
Purchase Money Mortgage
Create a Home Valuation Report for This Property
The Home Valuation Report is an in-depth analysis detailing your home's value as well as a comparison with similar homes in the area
Home Values in the Area
Average Home Value in this Area
Purchase History
| Date | Buyer | Sale Price | Title Company |
|---|---|---|---|
| Coleman Agnes M | $415,000 | -- | |
| Barry William T | $177,000 | -- |
Source: Public Records
Mortgage History
| Date | Status | Borrower | Loan Amount |
|---|---|---|---|
| Previous Owner | Barry William T | $205,000 |
Source: Public Records
Tax History Compared to Growth
Tax History
| Year | Tax Paid | Tax Assessment Tax Assessment Total Assessment is a certain percentage of the fair market value that is determined by local assessors to be the total taxable value of land and additions on the property. | Land | Improvement |
|---|---|---|---|---|
| 2025 | $8,998 | $780,400 | $315,900 | $464,500 |
| 2024 | $8,535 | $757,300 | $301,100 | $456,200 |
| 2023 | $7,778 | $698,800 | $274,300 | $424,500 |
| 2022 | $7,496 | $625,700 | $229,500 | $396,200 |
| 2021 | $7,484 | $616,500 | $229,500 | $387,000 |
| 2020 | $7,529 | $605,700 | $229,500 | $376,200 |
| 2019 | $7,437 | $592,600 | $216,900 | $375,700 |
| 2018 | $6,339 | $475,200 | $201,300 | $273,900 |
| 2017 | $6,437 | $454,300 | $191,900 | $262,400 |
| 2016 | $5,843 | $406,900 | $167,700 | $239,200 |
| 2015 | $5,841 | $400,100 | $167,700 | $232,400 |
| 2014 | $5,461 | $367,500 | $167,700 | $199,800 |
Source: Public Records
Map
Nearby Homes
- 64 Garfield St Unit B
- 94 Brook Rd Unit 3
- 33 Brook Rd
- 56 Town Hill St Unit 56
- 46 Suomi Rd
- 46 Suomi Rd Unit 46
- 57 Buckley St
- 73 Scotch Pond Place
- 165 Granite St
- 92 Centre St
- 203 Centre St
- 72 Centre St Unit J
- 73 Cranch St Unit 73
- 8 Jackson St Unit B2
- 293 Whitwell St
- 57A West St
- 36 Greystone St Unit 36
- 1 Cityview Ln Unit 204
- 1 Cityview Ln Unit 506
- 145 Suomi Rd Unit C7
- 54 Garfield St
- 64 Garfield St
- 64 Garfield St Unit E
- 64 Garfield St Unit A
- 64 Garfield St Unit C
- 64 Garfield St Unit D
- 64 Garfield St Unit B
- 64 Garfield St Unit 2
- 64 Garfield St
- 45 Kidder St Unit 1
- 45 Kidder St
- 45 Kidder St Unit 2
- 49 Kidder St
- 43 Kidder St
- 55 Kidder St
- 51+64 Garfield
- 325 Granite St
- 319 Granite St Unit 1
- 319 Granite St
- 319 Granite St Unit 2