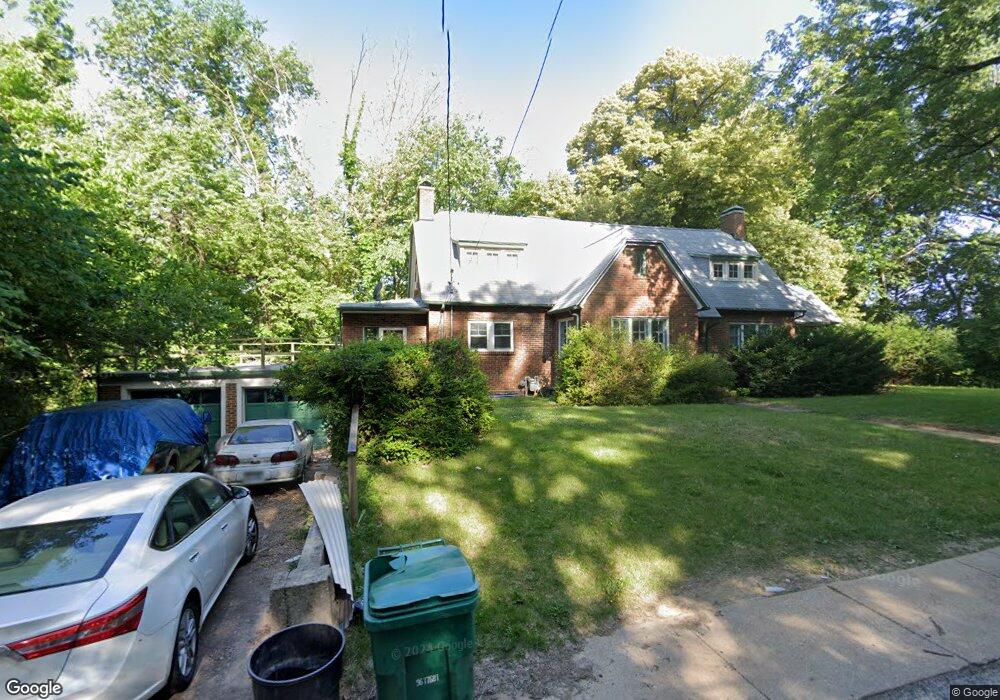
54 Granvue Dr Belleville, IL 62223
Estimated Value: $172,000 - $250,939
4
Beds
2
Baths
2,064
Sq Ft
$94/Sq Ft
Est. Value
About This Home
This home is located at 54 Granvue Dr, Belleville, IL 62223 and is currently estimated at $192,985, approximately $93 per square foot. 54 Granvue Dr is a home located in St. Clair County with nearby schools including Signal Hill Elementary School, Blessed Sacrament Catholic School, and Sister Thea Bowman Catholic School.
Ownership History
Date
Name
Owned For
Owner Type
Purchase Details
Closed on
Dec 21, 2010
Sold by
Vance Steven Robert
Bought by
Federal Home Loan Mortgage Corp
Current Estimated Value
Purchase Details
Closed on
Jun 18, 2001
Sold by
Hiden Franklin M and Hiden Kathy L
Bought by
Vance Steven Robert
Home Financials for this Owner
Home Financials are based on the most recent Mortgage that was taken out on this home.
Original Mortgage
$105,300
Interest Rate
7.16%
Create a Home Valuation Report for This Property
The Home Valuation Report is an in-depth analysis detailing your home's value as well as a comparison with similar homes in the area
Home Values in the Area
Average Home Value in this Area
Purchase History
| Date | Buyer | Sale Price | Title Company |
|---|---|---|---|
| Federal Home Loan Mortgage Corp | -- | None Available | |
| Vance Steven Robert | $117,000 | First American Title Ins Co |
Source: Public Records
Mortgage History
| Date | Status | Borrower | Loan Amount |
|---|---|---|---|
| Previous Owner | Vance Steven Robert | $105,300 |
Source: Public Records
Tax History
| Year | Tax Paid | Tax Assessment Tax Assessment Total Assessment is a certain percentage of the fair market value that is determined by local assessors to be the total taxable value of land and additions on the property. | Land | Improvement |
|---|---|---|---|---|
| 2024 | $4,711 | $55,848 | $6,092 | $49,756 |
| 2023 | $4,274 | $50,477 | $5,506 | $44,971 |
| 2022 | $3,820 | $44,240 | $4,826 | $39,414 |
| 2021 | $3,681 | $41,922 | $4,573 | $37,349 |
| 2020 | $3,964 | $44,759 | $4,791 | $39,968 |
| 2019 | $3,983 | $44,759 | $4,791 | $39,968 |
| 2018 | $4,062 | $45,413 | $4,861 | $40,552 |
| 2017 | $4,084 | $44,317 | $4,743 | $39,574 |
| 2016 | $4,340 | $44,899 | $4,725 | $40,174 |
| 2014 | $3,855 | $44,411 | $4,674 | $39,737 |
| 2013 | -- | $41,657 | $4,384 | $37,273 |
Source: Public Records
Map
Nearby Homes
Your Personal Tour Guide
Ask me questions while you tour the home.