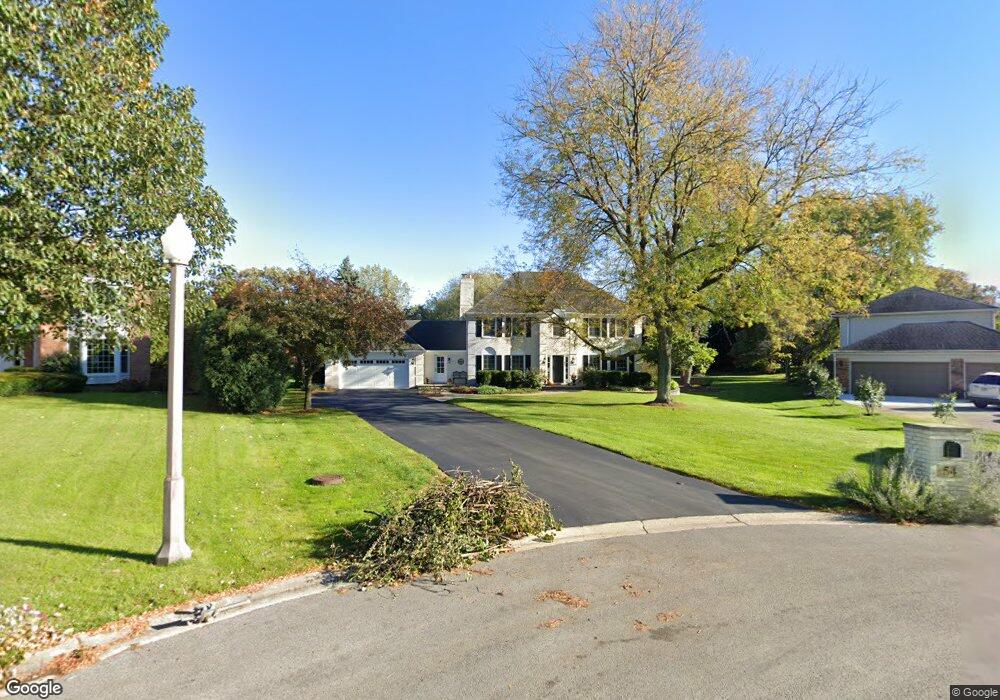
54 Highgate Course Saint Charles, IL 60174
Northeast Saint Charles NeighborhoodEstimated Value: $586,249 - $792,000
4
Beds
2
Baths
2,531
Sq Ft
$266/Sq Ft
Est. Value
About This Home
This home is located at 54 Highgate Course, Saint Charles, IL 60174 and is currently estimated at $672,062, approximately $265 per square foot. 54 Highgate Course is a home located in Kane County with nearby schools including Norton Creek Elementary School, Wredling Middle School, and St Charles East High School.
Ownership History
Date
Name
Owned For
Owner Type
Purchase Details
Closed on
Oct 15, 2004
Sold by
Grindean John E and Grindean Cassandra E
Bought by
Lewandowski Christopher P and Reid Lewandowski Kathleen A
Current Estimated Value
Home Financials for this Owner
Home Financials are based on the most recent Mortgage that was taken out on this home.
Original Mortgage
$437,665
Outstanding Balance
$232,960
Interest Rate
6.9%
Mortgage Type
Purchase Money Mortgage
Estimated Equity
$439,102
Purchase Details
Closed on
Oct 17, 1994
Sold by
Ackels Roger L and Ackels Roberta P
Bought by
Grindean John E and Grindean Cassandra E
Home Financials for this Owner
Home Financials are based on the most recent Mortgage that was taken out on this home.
Original Mortgage
$271,900
Interest Rate
4.8%
Create a Home Valuation Report for This Property
The Home Valuation Report is an in-depth analysis detailing your home's value as well as a comparison with similar homes in the area
Home Values in the Area
Average Home Value in this Area
Purchase History
| Date | Buyer | Sale Price | Title Company |
|---|---|---|---|
| Lewandowski Christopher P | $515,000 | Chicago Title Insurance Comp | |
| Grindean John E | $340,000 | -- |
Source: Public Records
Mortgage History
| Date | Status | Borrower | Loan Amount |
|---|---|---|---|
| Open | Lewandowski Christopher P | $437,665 | |
| Previous Owner | Grindean John E | $271,900 |
Source: Public Records
Tax History Compared to Growth
Tax History
| Year | Tax Paid | Tax Assessment Tax Assessment Total Assessment is a certain percentage of the fair market value that is determined by local assessors to be the total taxable value of land and additions on the property. | Land | Improvement |
|---|---|---|---|---|
| 2024 | $12,013 | $169,828 | $31,654 | $138,174 |
| 2023 | $11,525 | $151,999 | $28,331 | $123,668 |
| 2022 | $10,602 | $137,311 | $30,731 | $106,580 |
| 2021 | $10,185 | $130,885 | $29,293 | $101,592 |
| 2020 | $10,566 | $134,380 | $28,747 | $105,633 |
| 2019 | $10,376 | $131,719 | $28,178 | $103,541 |
| 2018 | $10,839 | $136,677 | $27,660 | $109,017 |
| 2017 | $11,484 | $143,060 | $26,713 | $116,347 |
| 2016 | $12,062 | $138,036 | $25,775 | $112,261 |
| 2015 | -- | $127,049 | $25,497 | $101,552 |
| 2014 | -- | $118,137 | $25,497 | $92,640 |
| 2013 | -- | $123,701 | $25,752 | $97,949 |
Source: Public Records
Map
Nearby Homes
- 12 Highgate Ct
- 33 Stirrup Cup Ct
- 3112 Turnberry Rd
- 55 Whittington Course
- 740 Courtyard Dr
- 92 Whittington Course
- 820 Derby Course
- 1919 Waverly Cir
- 3041 Majestic Oaks Ln Unit 2
- Lot 1 in Block 2 Norway Maple Addition To St Charles
- Lot 4 Mosedale St
- Lot 2 in Block 2 Norway Maple Addition To St Charles
- 3706 Royal Fox Dr
- 2450 Persimmon Dr
- 4308 Royal Windyne Ct
- 444 Lakeshore Ct
- 289 Charlestowne Lakes Dr
- 291 Charlestowne Lakes Dr
- ASHTON Plan at Charlestowne Lakes
- GRANT Plan at Charlestowne Lakes
- 50 Highgate Course
- 58 Highgate Course
- 46 Highgate Course
- 62 Highgate Course
- 2501 Muirfield Ct
- 195 Muirfield Ct
- 42 Highgate Course
- 70 Highgate Course
- 66 Highgate Course
- 2503 Muirfield Ct
- 37 Highgate Course
- 41 Highgate Course
- 41 Highgate Course
- 38 Highgate Course
- 33 Highgate Course
- 74 Highgate Course
- 2502 Muirfield Ct
- 2505 Muirfield Ct
- 33 Highgate Course
- 2504 Muirfield Ct