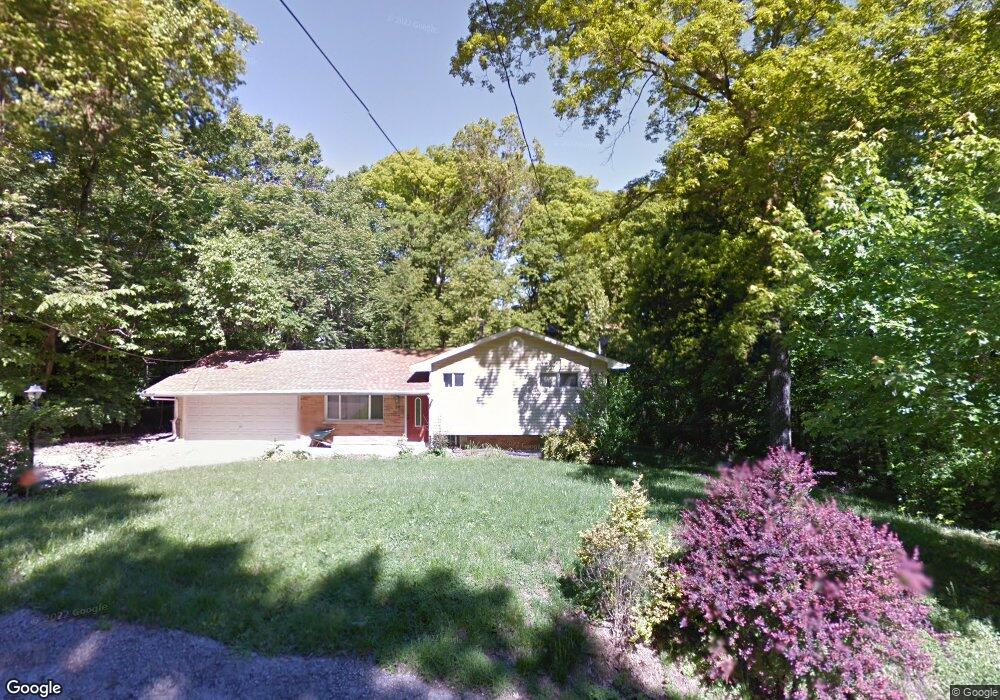
54 Highwood Rd Belleville, IL 62223
Estimated Value: $119,000 - $179,000
3
Beds
1
Bath
1,130
Sq Ft
$129/Sq Ft
Est. Value
About This Home
This home is located at 54 Highwood Rd, Belleville, IL 62223 and is currently estimated at $145,537, approximately $128 per square foot. 54 Highwood Rd is a home located in St. Clair County with nearby schools including Illini Elementary School, Grant Middle School, and Blessed Sacrament Catholic School.
Ownership History
Date
Name
Owned For
Owner Type
Purchase Details
Closed on
Jun 21, 2010
Sold by
Primacy Closing Corporation
Bought by
Dobos Matthew
Current Estimated Value
Home Financials for this Owner
Home Financials are based on the most recent Mortgage that was taken out on this home.
Original Mortgage
$93,737
Outstanding Balance
$62,823
Interest Rate
4.97%
Mortgage Type
FHA
Estimated Equity
$82,714
Purchase Details
Closed on
Aug 14, 2009
Sold by
Sullivan Jared A and Sullivan Nicole M
Bought by
Primacy Closing Corporation
Purchase Details
Closed on
Nov 1, 2001
Sold by
Graham John Kenneth and Graham Stephanie E
Bought by
Sullivan Jared A and Sullivan Nicole M
Home Financials for this Owner
Home Financials are based on the most recent Mortgage that was taken out on this home.
Original Mortgage
$74,851
Interest Rate
6.8%
Mortgage Type
FHA
Create a Home Valuation Report for This Property
The Home Valuation Report is an in-depth analysis detailing your home's value as well as a comparison with similar homes in the area
Home Values in the Area
Average Home Value in this Area
Purchase History
| Date | Buyer | Sale Price | Title Company |
|---|---|---|---|
| Dobos Matthew | $95,000 | Accommodation | |
| Primacy Closing Corporation | $95,000 | Accommodation | |
| Sullivan Jared A | $76,000 | Metro East Title |
Source: Public Records
Mortgage History
| Date | Status | Borrower | Loan Amount |
|---|---|---|---|
| Open | Dobos Matthew | $93,737 | |
| Previous Owner | Sullivan Jared A | $74,851 |
Source: Public Records
Tax History
| Year | Tax Paid | Tax Assessment Tax Assessment Total Assessment is a certain percentage of the fair market value that is determined by local assessors to be the total taxable value of land and additions on the property. | Land | Improvement |
|---|---|---|---|---|
| 2024 | $3,381 | $41,183 | $4,379 | $36,804 |
| 2023 | $3,043 | $35,710 | $4,292 | $31,418 |
| 2022 | $2,734 | $32,148 | $3,864 | $28,284 |
| 2021 | $2,531 | $29,720 | $3,572 | $26,148 |
| 2020 | $2,419 | $28,105 | $3,378 | $24,727 |
| 2019 | $2,318 | $27,136 | $3,383 | $23,753 |
| 2018 | $2,229 | $26,549 | $3,310 | $23,239 |
| 2017 | $2,226 | $26,363 | $3,287 | $23,076 |
| 2016 | $2,204 | $25,803 | $3,217 | $22,586 |
| 2014 | $2,077 | $27,452 | $2,316 | $25,136 |
| 2013 | $2,183 | $27,844 | $2,349 | $25,495 |
Source: Public Records
Map
Nearby Homes
- 300 Highwood Dr
- 55 Highwood Rd
- 312 Highwood Dr
- 41 Highwood Rd
- 221 Highwood Dr
- 24 Highwood Ct
- 212 Highwood Dr
- 212 Highwood Dr
- 316 Highwood Dr
- 37 Highwood Ct
- 217 Highwood Dr
- 38 Highwood Dr
- 38 Highwood Dr
- 22 Highwood Rd
- 213 Highwood Dr
- 21 Highwood Ct
- 25 Highwood Ct
- 33 Highwood Ct
- 209 Highwood Dr
- 29 Highwood Ct
Your Personal Tour Guide
Ask me questions while you tour the home.