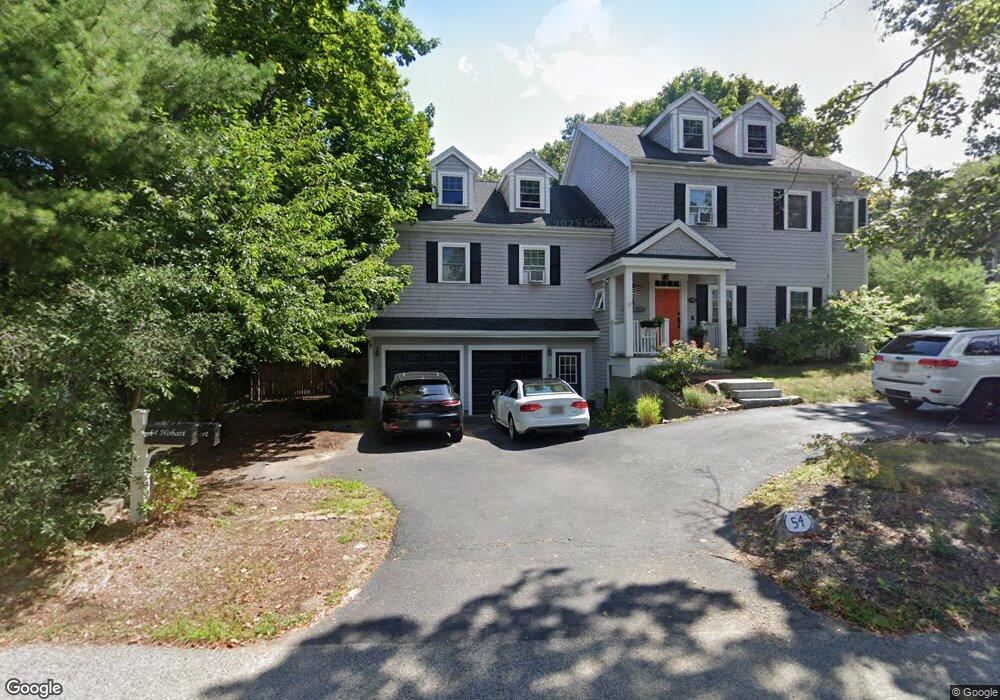
54 Hobart St Hingham, MA 02043
Estimated Value: $898,000 - $1,584,000
3
Beds
2
Baths
1,129
Sq Ft
$1,112/Sq Ft
Est. Value
About This Home
This home is located at 54 Hobart St, Hingham, MA 02043 and is currently estimated at $1,255,200, approximately $1,111 per square foot. 54 Hobart St is a home located in Plymouth County with nearby schools including Plymouth River Elementary School, Hingham Middle School, and Hingham High School.
Ownership History
Date
Name
Owned For
Owner Type
Purchase Details
Closed on
Aug 31, 2010
Sold by
Us Bk
Bought by
Callahan Sean and Callahan Maureen
Current Estimated Value
Home Financials for this Owner
Home Financials are based on the most recent Mortgage that was taken out on this home.
Original Mortgage
$276,180
Outstanding Balance
$189,715
Interest Rate
5.25%
Mortgage Type
FHA
Estimated Equity
$1,065,485
Purchase Details
Closed on
Jun 29, 2010
Sold by
Bennett Christopher D
Bought by
Us Bk
Create a Home Valuation Report for This Property
The Home Valuation Report is an in-depth analysis detailing your home's value as well as a comparison with similar homes in the area
Purchase History
| Date | Buyer | Sale Price | Title Company |
|---|---|---|---|
| Callahan Sean | $279,900 | -- | |
| Us Bk | $403,150 | -- |
Source: Public Records
Mortgage History
| Date | Status | Borrower | Loan Amount |
|---|---|---|---|
| Open | Callahan Sean | $276,180 |
Source: Public Records
Tax History
| Year | Tax Paid | Tax Assessment Tax Assessment Total Assessment is a certain percentage of the fair market value that is determined by local assessors to be the total taxable value of land and additions on the property. | Land | Improvement |
|---|---|---|---|---|
| 2025 | $11,230 | $1,050,500 | $494,300 | $556,200 |
| 2024 | $10,878 | $1,002,600 | $494,300 | $508,300 |
| 2023 | $9,574 | $957,400 | $494,300 | $463,100 |
| 2022 | $9,083 | $785,700 | $411,800 | $373,900 |
| 2021 | $8,895 | $753,800 | $411,800 | $342,000 |
| 2020 | $8,691 | $753,800 | $411,800 | $342,000 |
| 2019 | $8,651 | $732,500 | $411,800 | $320,700 |
| 2018 | $8,622 | $732,500 | $411,800 | $320,700 |
| 2017 | $0 | $472,000 | $370,700 | $101,300 |
| 2016 | $4,710 | $377,100 | $353,000 | $24,100 |
| 2015 | $4,473 | $357,000 | $336,000 | $21,000 |
Source: Public Records
Map
Nearby Homes
Your Personal Tour Guide
Ask me questions while you tour the home.