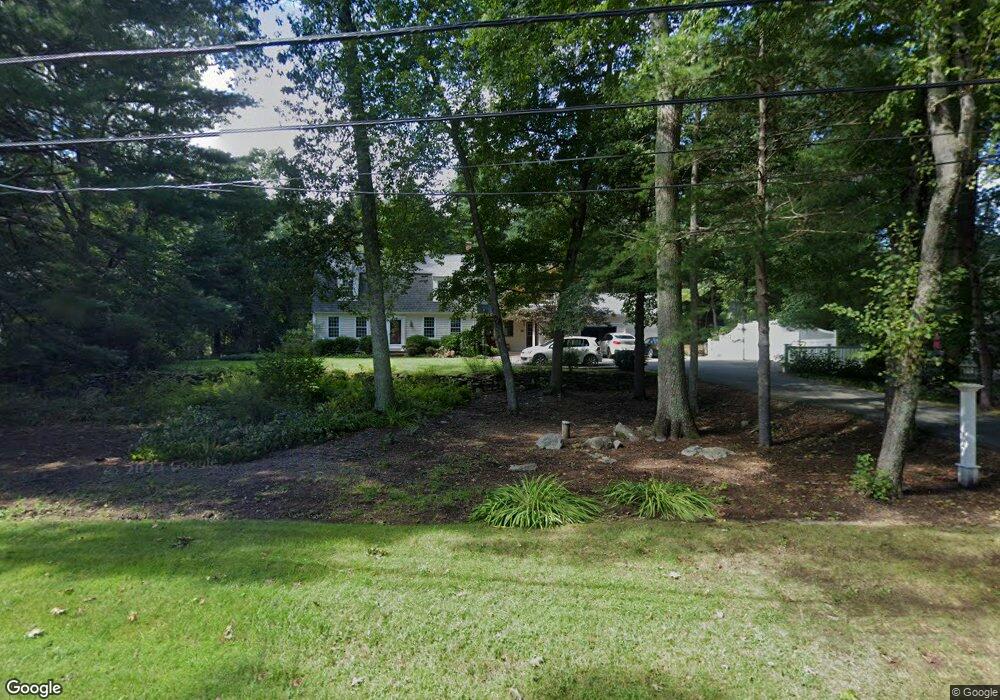
54 Ivy Ln Sherborn, MA 01770
Estimated Value: $1,380,000 - $1,563,000
4
Beds
4
Baths
4,280
Sq Ft
$347/Sq Ft
Est. Value
About This Home
This home is located at 54 Ivy Ln, Sherborn, MA 01770 and is currently estimated at $1,485,768, approximately $347 per square foot. 54 Ivy Ln is a home located in Middlesex County with nearby schools including Pine Hill Elementary School, Dover-Sherborn Regional Middle School, and Dover-Sherborn Regional High School.
Ownership History
Date
Name
Owned For
Owner Type
Purchase Details
Closed on
Apr 18, 2003
Sold by
Crowley Gay E and Crowley Eugene L
Bought by
Olson Catherine and Olson Keith E
Current Estimated Value
Home Financials for this Owner
Home Financials are based on the most recent Mortgage that was taken out on this home.
Original Mortgage
$515,000
Interest Rate
5.75%
Mortgage Type
Purchase Money Mortgage
Purchase Details
Closed on
Mar 13, 1989
Sold by
Flynn E Michael
Bought by
Crowley Eugene L
Create a Home Valuation Report for This Property
The Home Valuation Report is an in-depth analysis detailing your home's value as well as a comparison with similar homes in the area
Home Values in the Area
Average Home Value in this Area
Purchase History
| Date | Buyer | Sale Price | Title Company |
|---|---|---|---|
| Olson Catherine | $820,000 | -- | |
| Crowley Eugene L | $360,000 | -- |
Source: Public Records
Mortgage History
| Date | Status | Borrower | Loan Amount |
|---|---|---|---|
| Open | Crowley Eugene L | $400,000 | |
| Closed | Olson Catherine | $515,000 | |
| Previous Owner | Crowley Eugene L | $200,000 | |
| Previous Owner | Crowley Eugene L | $202,000 |
Source: Public Records
Tax History
| Year | Tax Paid | Tax Assessment Tax Assessment Total Assessment is a certain percentage of the fair market value that is determined by local assessors to be the total taxable value of land and additions on the property. | Land | Improvement |
|---|---|---|---|---|
| 2025 | $22,204 | $1,339,200 | $459,800 | $879,400 |
| 2024 | $20,625 | $1,216,800 | $459,800 | $757,000 |
| 2023 | $18,433 | $1,023,500 | $459,800 | $563,700 |
| 2022 | $17,342 | $911,300 | $449,100 | $462,200 |
| 2021 | $5,849 | $870,000 | $449,100 | $420,900 |
| 2020 | $16,930 | $870,000 | $449,100 | $420,900 |
| 2019 | $16,960 | $864,400 | $449,100 | $415,300 |
| 2018 | $5,353 | $850,300 | $449,100 | $401,200 |
| 2017 | $16,327 | $798,000 | $449,100 | $348,900 |
| 2016 | $16,238 | $789,400 | $449,100 | $340,300 |
| 2015 | $15,982 | $786,500 | $444,100 | $342,400 |
| 2014 | $15,286 | $751,500 | $424,100 | $327,400 |
Source: Public Records
Map
Nearby Homes
- 5 Farm Rd
- 14 Sewall Brook Ln
- 90 Maple St
- 32 Cider Hill Ln
- 65 Farm Road Lot 6
- 174 S Main St
- 20 Nason Hill Rd
- 137 Lake St
- 59 Spywood Rd
- 14 Fiske Pond Rd
- 27 Spywood Rd
- 00000 S Main St and Bullard St
- 21 Spywood Rd
- 615 Mayflower Landing
- 81 Brush Hill Rd
- 9 Adams Ln Unit 9
- 1 Adams Ln Unit 1
- 6 Hopewell Farm Rd
- 11 Morgan Dr Unit 404
- 103 Farm St
Your Personal Tour Guide
Ask me questions while you tour the home.