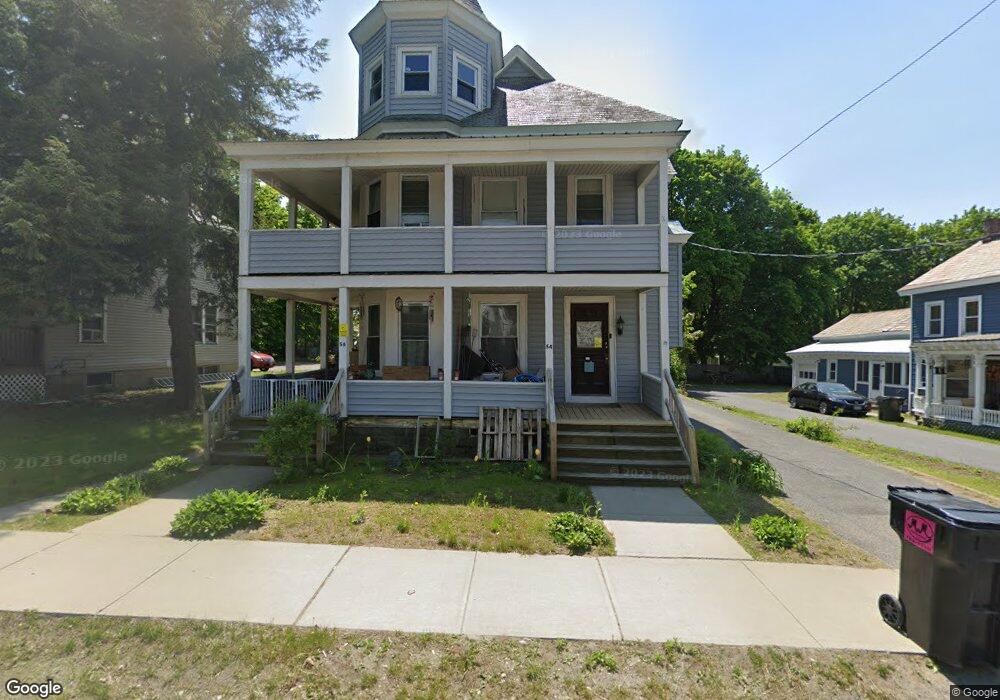
54 John St Unit 56 Hudson Falls, NY 12839
Estimated Value: $192,000 - $212,000
4
Beds
2
Baths
3,500
Sq Ft
$58/Sq Ft
Est. Value
About This Home
This home is located at 54 John St Unit 56, Hudson Falls, NY 12839 and is currently estimated at $203,691, approximately $58 per square foot. 54 John St Unit 56 is a home located in Washington County with nearby schools including Margaret Murphy Kindergarten Center, Hudson Falls Intermediate School, and Hudson Falls Primary School.
Ownership History
Date
Name
Owned For
Owner Type
Purchase Details
Closed on
Dec 12, 2006
Sold by
Riley Michael
Bought by
Brown Sean
Current Estimated Value
Home Financials for this Owner
Home Financials are based on the most recent Mortgage that was taken out on this home.
Original Mortgage
$67,200
Outstanding Balance
$24,266
Interest Rate
6.31%
Mortgage Type
Purchase Money Mortgage
Estimated Equity
$179,425
Purchase Details
Closed on
Jul 22, 1999
Sold by
Rosenthal Mark
Bought by
Riley Michael A and Riley Emerita D
Purchase Details
Closed on
Jan 5, 1998
Purchase Details
Closed on
Jul 23, 1997
Purchase Details
Closed on
Mar 19, 1997
Create a Home Valuation Report for This Property
The Home Valuation Report is an in-depth analysis detailing your home's value as well as a comparison with similar homes in the area
Home Values in the Area
Average Home Value in this Area
Purchase History
| Date | Buyer | Sale Price | Title Company |
|---|---|---|---|
| Brown Sean | $84,000 | Mark Noordsy | |
| Riley Michael A | $62,500 | -- | |
| -- | -- | -- | |
| -- | -- | -- | |
| -- | -- | -- | |
| -- | $87,204 | -- |
Source: Public Records
Mortgage History
| Date | Status | Borrower | Loan Amount |
|---|---|---|---|
| Open | Brown Sean | $67,200 |
Source: Public Records
Tax History Compared to Growth
Tax History
| Year | Tax Paid | Tax Assessment Tax Assessment Total Assessment is a certain percentage of the fair market value that is determined by local assessors to be the total taxable value of land and additions on the property. | Land | Improvement |
|---|---|---|---|---|
| 2024 | $4,243 | $163,900 | $7,800 | $156,100 |
| 2023 | $3,387 | $126,600 | $7,800 | $118,800 |
| 2022 | $3,579 | $126,600 | $7,800 | $118,800 |
| 2021 | $3,639 | $123,200 | $7,800 | $115,400 |
| 2020 | $4,001 | $123,200 | $7,800 | $115,400 |
| 2019 | $7,341 | $123,200 | $7,800 | $115,400 |
| 2018 | $7,341 | $123,200 | $7,800 | $115,400 |
| 2017 | $4,087 | $118,600 | $7,800 | $110,800 |
| 2016 | $4,955 | $118,600 | $7,800 | $110,800 |
| 2015 | -- | $118,600 | $7,800 | $110,800 |
| 2014 | -- | $118,600 | $7,800 | $110,800 |
Source: Public Records
Map
Nearby Homes