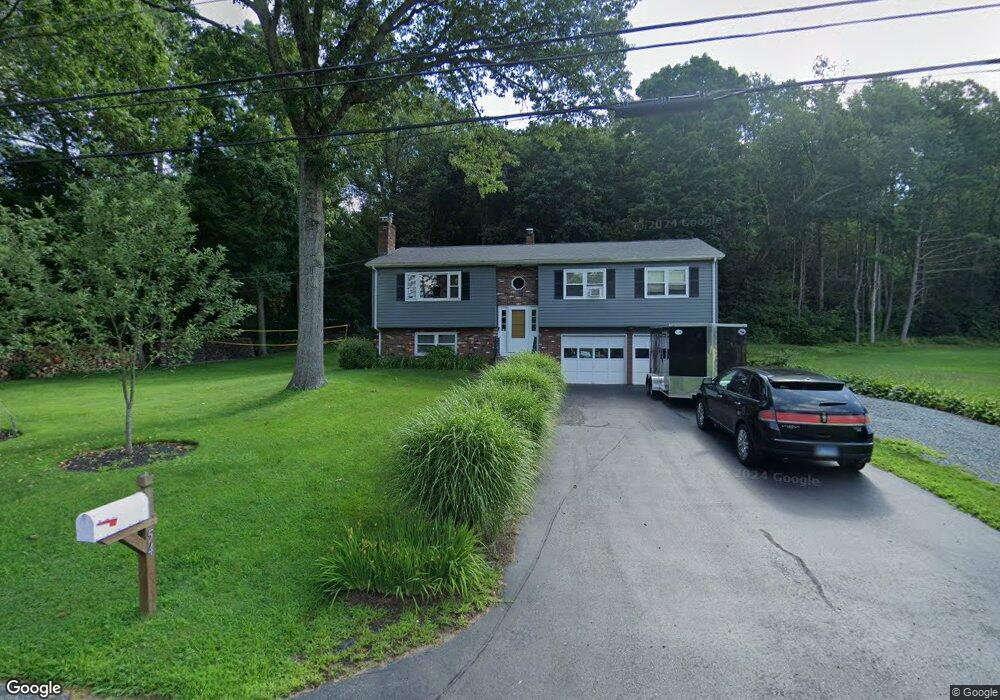
54 Kent St Danielson, CT 06239
Estimated Value: $372,000 - $420,000
4
Beds
7
Baths
1,332
Sq Ft
$298/Sq Ft
Est. Value
About This Home
This home is located at 54 Kent St, Danielson, CT 06239 and is currently estimated at $396,596, approximately $297 per square foot. 54 Kent St is a home located in Windham County with nearby schools including Killingly Central School, Killingly Memorial School, and Killingly Intermediate School.
Ownership History
Date
Name
Owned For
Owner Type
Purchase Details
Closed on
Jan 21, 2010
Sold by
Suprenant Jonathan
Bought by
Suprenant Jonathan and Suprenant Beth A
Current Estimated Value
Home Financials for this Owner
Home Financials are based on the most recent Mortgage that was taken out on this home.
Original Mortgage
$169,375
Outstanding Balance
$108,388
Interest Rate
4.85%
Mortgage Type
Purchase Money Mortgage
Estimated Equity
$288,208
Purchase Details
Closed on
Dec 31, 2009
Sold by
Stover Jennifer M and Ledoux Michael S
Bought by
Suprenant Jonathan
Home Financials for this Owner
Home Financials are based on the most recent Mortgage that was taken out on this home.
Original Mortgage
$169,375
Outstanding Balance
$108,388
Interest Rate
4.85%
Mortgage Type
Purchase Money Mortgage
Estimated Equity
$288,208
Purchase Details
Closed on
Nov 14, 2008
Sold by
Ionkin Pavel E and Ionkin Elena N
Bought by
Ledoux Michael S and Stover Jennifer M
Purchase Details
Closed on
Jun 29, 1999
Sold by
Zadora Leonard
Bought by
Ionkin Pavel E and Ionkin Elena N
Create a Home Valuation Report for This Property
The Home Valuation Report is an in-depth analysis detailing your home's value as well as a comparison with similar homes in the area
Home Values in the Area
Average Home Value in this Area
Purchase History
| Date | Buyer | Sale Price | Title Company |
|---|---|---|---|
| Suprenant Jonathan | $172,500 | -- | |
| Suprenant Jonathan | $172,500 | -- | |
| Suprenant Jonathan | $172,500 | -- | |
| Suprenant Jonathan | $172,500 | -- | |
| Ledoux Michael S | $210,000 | -- | |
| Ledoux Michael S | $210,000 | -- | |
| Ionkin Pavel E | $110,000 | -- | |
| Ionkin Pavel E | $110,000 | -- |
Source: Public Records
Mortgage History
| Date | Status | Borrower | Loan Amount |
|---|---|---|---|
| Open | Ionkin Pavel E | $169,375 | |
| Closed | Ionkin Pavel E | $169,375 |
Source: Public Records
Tax History
| Year | Tax Paid | Tax Assessment Tax Assessment Total Assessment is a certain percentage of the fair market value that is determined by local assessors to be the total taxable value of land and additions on the property. | Land | Improvement |
|---|---|---|---|---|
| 2025 | $4,453 | $203,050 | $28,820 | $174,230 |
| 2024 | $4,223 | $203,050 | $28,820 | $174,230 |
| 2023 | $3,902 | $141,570 | $23,830 | $117,740 |
| 2022 | $3,656 | $141,820 | $24,080 | $117,740 |
| 2021 | $3,650 | $141,820 | $24,080 | $117,740 |
| 2020 | $3,577 | $141,820 | $24,080 | $117,740 |
| 2019 | $3,622 | $141,820 | $24,080 | $117,740 |
| 2017 | $3,149 | $112,630 | $15,400 | $97,230 |
| 2016 | $3,157 | $112,630 | $15,400 | $97,230 |
| 2015 | $3,153 | $112,630 | $15,400 | $97,230 |
| 2014 | $3,065 | $112,630 | $15,400 | $97,230 |
Source: Public Records
Map
Nearby Homes
Your Personal Tour Guide
Ask me questions while you tour the home.