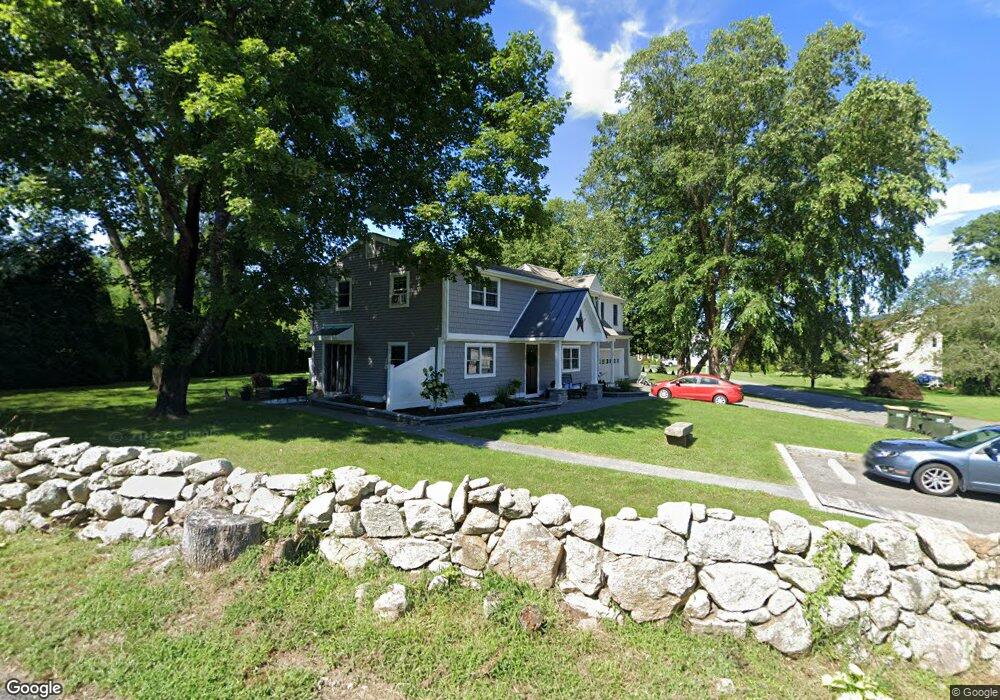
54 Kirby Rd Unit 56 Westport, MA 02790
Booth/Handy Four Corners NeighborhoodEstimated Value: $565,000 - $711,000
2
Beds
--
Bath
2,660
Sq Ft
$241/Sq Ft
Est. Value
About This Home
This home is located at 54 Kirby Rd Unit 56, Westport, MA 02790 and is currently estimated at $641,442, approximately $241 per square foot. 54 Kirby Rd Unit 56 is a home located in Bristol County with nearby schools including Alice A. Macomber Primary School, Westport Elementary School, and Westport Middle-High School.
Ownership History
Date
Name
Owned For
Owner Type
Purchase Details
Closed on
Jan 22, 2001
Sold by
Henriques Ross M and Henriques Jennifer
Bought by
Phelan Karen L
Current Estimated Value
Home Financials for this Owner
Home Financials are based on the most recent Mortgage that was taken out on this home.
Original Mortgage
$157,700
Interest Rate
7.52%
Mortgage Type
Purchase Money Mortgage
Purchase Details
Closed on
Aug 30, 1999
Sold by
Reis John and Reis Luisa
Bought by
Henriques Ross M and Henriques Jennifer
Create a Home Valuation Report for This Property
The Home Valuation Report is an in-depth analysis detailing your home's value as well as a comparison with similar homes in the area
Home Values in the Area
Average Home Value in this Area
Purchase History
| Date | Buyer | Sale Price | Title Company |
|---|---|---|---|
| Phelan Karen L | $166,000 | -- | |
| Henriques Ross M | $137,500 | -- |
Source: Public Records
Mortgage History
| Date | Status | Borrower | Loan Amount |
|---|---|---|---|
| Open | Henriques Ross M | $70,000 | |
| Closed | Henriques Ross M | $40,000 | |
| Open | Henriques Ross M | $235,000 | |
| Closed | Henriques Ross M | $157,700 |
Source: Public Records
Tax History Compared to Growth
Tax History
| Year | Tax Paid | Tax Assessment Tax Assessment Total Assessment is a certain percentage of the fair market value that is determined by local assessors to be the total taxable value of land and additions on the property. | Land | Improvement |
|---|---|---|---|---|
| 2025 | $3,920 | $526,200 | $184,400 | $341,800 |
| 2024 | $3,942 | $509,900 | $170,800 | $339,100 |
| 2023 | $3,059 | $374,900 | $143,900 | $231,000 |
| 2022 | $2,937 | $346,300 | $143,900 | $202,400 |
| 2021 | $2,872 | $333,200 | $130,800 | $202,400 |
| 2020 | $2,719 | $322,500 | $120,100 | $202,400 |
| 2019 | $2,431 | $293,900 | $109,200 | $184,700 |
| 2018 | $2,144 | $262,400 | $110,400 | $152,000 |
| 2017 | $2,080 | $261,000 | $106,900 | $154,100 |
| 2016 | $1,951 | $246,700 | $103,300 | $143,400 |
| 2015 | $1,948 | $245,700 | $105,700 | $140,000 |
Source: Public Records
Map
Nearby Homes
- 7 Village Way
- 8 Village Way
- 15 Village Way
- 837 Main Rd
- 8 Strawberry Ln
- 118 Charlotte White Rd Extension
- 0 Hidden Glen Ln
- 920 Drift Rd
- 101 Adamsville Rd
- 225 Hixbridge Rd
- 118 Charlotte White Rd
- Lot 0 Marcotte
- 978 Sodom Rd
- 47 Fallon Dr
- 73 White Oak Run
- 4 Main Rd
- 1346 Main Rd Unit B
- 6 Angel Ct
- 99 Sylvia Ln
- 308 Robert St