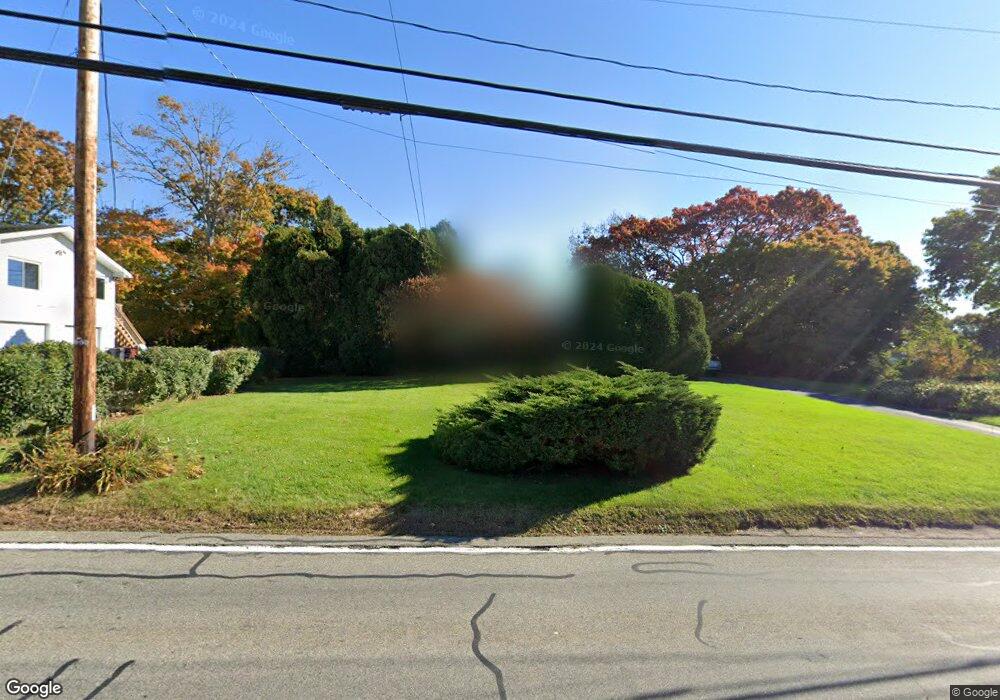
54 Langworthy Rd Westerly, RI 02891
Estimated Value: $744,680 - $847,000
5
Beds
3
Baths
2,402
Sq Ft
$332/Sq Ft
Est. Value
About This Home
This home is located at 54 Langworthy Rd, Westerly, RI 02891 and is currently estimated at $798,420, approximately $332 per square foot. 54 Langworthy Rd is a home located in Washington County with nearby schools including Westerly High School.
Ownership History
Date
Name
Owned For
Owner Type
Purchase Details
Closed on
Jan 18, 2018
Sold by
Larose Timothy J and Larose Michelle L
Bought by
Musard Daniel E and Musard Kristen A
Current Estimated Value
Home Financials for this Owner
Home Financials are based on the most recent Mortgage that was taken out on this home.
Original Mortgage
$382,500
Outstanding Balance
$321,276
Interest Rate
3.94%
Mortgage Type
New Conventional
Estimated Equity
$477,144
Purchase Details
Closed on
Apr 22, 1994
Sold by
Mcandrew David L
Bought by
Mcandrew Thomas J
Home Financials for this Owner
Home Financials are based on the most recent Mortgage that was taken out on this home.
Original Mortgage
$102,000
Interest Rate
7.6%
Create a Home Valuation Report for This Property
The Home Valuation Report is an in-depth analysis detailing your home's value as well as a comparison with similar homes in the area
Home Values in the Area
Average Home Value in this Area
Purchase History
| Date | Buyer | Sale Price | Title Company |
|---|---|---|---|
| Musard Daniel E | $425,000 | -- | |
| Mcandrew Thomas J | $158,000 | -- | |
| Musard Daniel E | $425,000 | -- | |
| Mcandrew Thomas J | $158,000 | -- |
Source: Public Records
Mortgage History
| Date | Status | Borrower | Loan Amount |
|---|---|---|---|
| Open | Musard Daniel E | $382,500 | |
| Closed | Mcandrew Thomas J | $382,500 | |
| Previous Owner | Mcandrew Thomas J | $87,491 | |
| Previous Owner | Mcandrew Thomas J | $102,000 |
Source: Public Records
Tax History Compared to Growth
Tax History
| Year | Tax Paid | Tax Assessment Tax Assessment Total Assessment is a certain percentage of the fair market value that is determined by local assessors to be the total taxable value of land and additions on the property. | Land | Improvement |
|---|---|---|---|---|
| 2025 | $3,805 | $535,200 | $188,900 | $346,300 |
| 2024 | $4,392 | $447,700 | $135,700 | $312,000 |
| 2023 | $4,307 | $447,700 | $135,700 | $312,000 |
| 2022 | $4,280 | $447,700 | $135,700 | $312,000 |
| 2021 | $4,031 | $349,900 | $118,300 | $231,600 |
| 2020 | $3,957 | $349,900 | $118,300 | $231,600 |
| 2019 | $3,919 | $349,900 | $118,300 | $231,600 |
| 2018 | $3,638 | $306,200 | $118,300 | $187,900 |
| 2017 | $3,549 | $306,200 | $118,300 | $187,900 |
| 2016 | $3,576 | $306,200 | $118,300 | $187,900 |
| 2015 | $3,392 | $313,500 | $120,800 | $192,700 |
| 2014 | $3,336 | $313,500 | $120,800 | $192,700 |
Source: Public Records
Map
Nearby Homes
- 30 Clifford Dr
- 11 Bucks Trail
- 2 Belle Rose Dr Unit A
- 33 Stuart St
- 17 Plateau Rd
- 10 Morris Rd
- 15 Breach Dr
- 14 Piezzo Dr
- 597 Atlantic Ave
- 5 Robin Hollow Ln
- 7 Fenway Rd
- 470 Atlantic Ave
- 54 Sherwood Dr
- 342 Post Rd
- 446 Atlantic Ave
- 346 Post Rd
- 432 Atlantic Ave
- 11 Hamilton Rd
- 118 Dunns Corner Rd
- 12 Fallon Trail