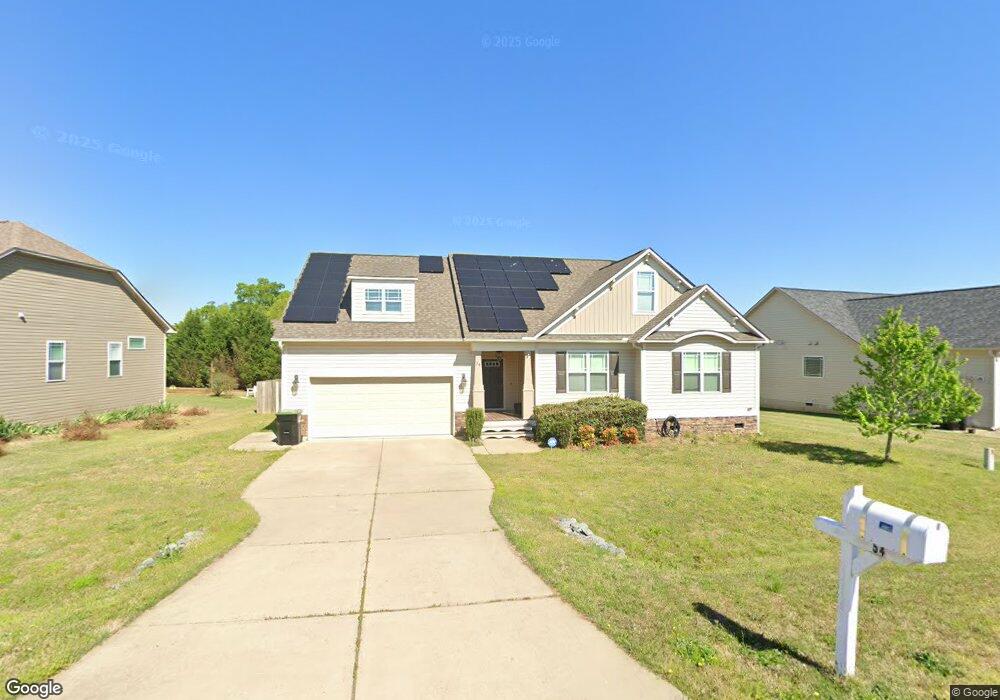
54 Lars Ln Unit Rand2 Garner, NC 27529
Estimated Value: $414,000 - $419,000
3
Beds
2
Baths
1,928
Sq Ft
$216/Sq Ft
Est. Value
About This Home
This home is located at 54 Lars Ln Unit Rand2, Garner, NC 27529 and is currently estimated at $417,305, approximately $216 per square foot. 54 Lars Ln Unit Rand2 is a home located in Johnston County with nearby schools including Cleveland Elementary School, Cleveland Middle School, and Cleveland High School.
Ownership History
Date
Name
Owned For
Owner Type
Purchase Details
Closed on
Sep 24, 2020
Sold by
Parisi Paul A and Parisi Kaitlin M
Bought by
Watson Rashaun and Watson Pamela Cabell
Current Estimated Value
Home Financials for this Owner
Home Financials are based on the most recent Mortgage that was taken out on this home.
Original Mortgage
$282,783
Outstanding Balance
$251,520
Interest Rate
2.9%
Mortgage Type
FHA
Estimated Equity
$165,785
Purchase Details
Closed on
May 1, 2014
Sold by
Golden Properties & Development Inc
Bought by
Parisi Paul A and Parisi Kaitlin M
Home Financials for this Owner
Home Financials are based on the most recent Mortgage that was taken out on this home.
Original Mortgage
$186,900
Interest Rate
4.44%
Mortgage Type
VA
Purchase Details
Closed on
May 15, 2013
Sold by
Capital Properties Of Raleigh Ii Llc
Bought by
Golden Properties & Development Inc
Create a Home Valuation Report for This Property
The Home Valuation Report is an in-depth analysis detailing your home's value as well as a comparison with similar homes in the area
Home Values in the Area
Average Home Value in this Area
Purchase History
| Date | Buyer | Sale Price | Title Company |
|---|---|---|---|
| Watson Rashaun | $288,000 | None Available | |
| Parisi Paul A | $187,000 | None Available | |
| Golden Properties & Development Inc | $90,000 | None Available |
Source: Public Records
Mortgage History
| Date | Status | Borrower | Loan Amount |
|---|---|---|---|
| Open | Watson Rashaun | $282,783 | |
| Previous Owner | Parisi Paul A | $186,900 |
Source: Public Records
Tax History
| Year | Tax Paid | Tax Assessment Tax Assessment Total Assessment is a certain percentage of the fair market value that is determined by local assessors to be the total taxable value of land and additions on the property. | Land | Improvement |
|---|---|---|---|---|
| 2025 | $2,670 | $420,400 | $85,000 | $335,400 |
| 2024 | $2,227 | $274,960 | $55,000 | $219,960 |
| 2023 | $2,152 | $274,960 | $55,000 | $219,960 |
| 2022 | $2,262 | $274,960 | $55,000 | $219,960 |
| 2021 | $2,262 | $274,960 | $55,000 | $219,960 |
| 2020 | $2,289 | $274,960 | $55,000 | $219,960 |
| 2019 | $2,289 | $274,960 | $55,000 | $219,960 |
| 2018 | $1,856 | $217,760 | $30,000 | $187,760 |
| 2017 | $1,856 | $217,760 | $30,000 | $187,760 |
| 2016 | $1,856 | $217,760 | $30,000 | $187,760 |
| 2015 | $1,086 | $217,760 | $30,000 | $187,760 |
| 2014 | $1,086 | $127,350 | $30,000 | $97,350 |
Source: Public Records
Map
Nearby Homes
- 98 Fairbanks Ave
- 172 Fairbanks Ave
- 76 Fairbanks Ave
- 93 Kinsale Ct
- 77 Ravensworth Dr
- 136 Newport Landing
- 339 Allen Rd
- 26 Langdon Pointe Dr
- 361 Ravensworth Dr
- 167 Merrifield Ln Unit 121
- Plan 3040 at Annandale
- Plan 2628 at Annandale
- Plan 3629 at Annandale
- Plan 3320 at Annandale
- Plan 3327 at Annandale
- Plan 3130 at Annandale
- Plan 3210 at Annandale
- Plan 2721 at Annandale
- Plan 3119 at Annandale
- Plan 2604 at Annandale
Your Personal Tour Guide
Ask me questions while you tour the home.