54 Leonard Rd Marshfield, MA 02050
Green Harbor-Cedar Crest NeighborhoodEstimated Value: $869,145 - $1,186,000
About This Home
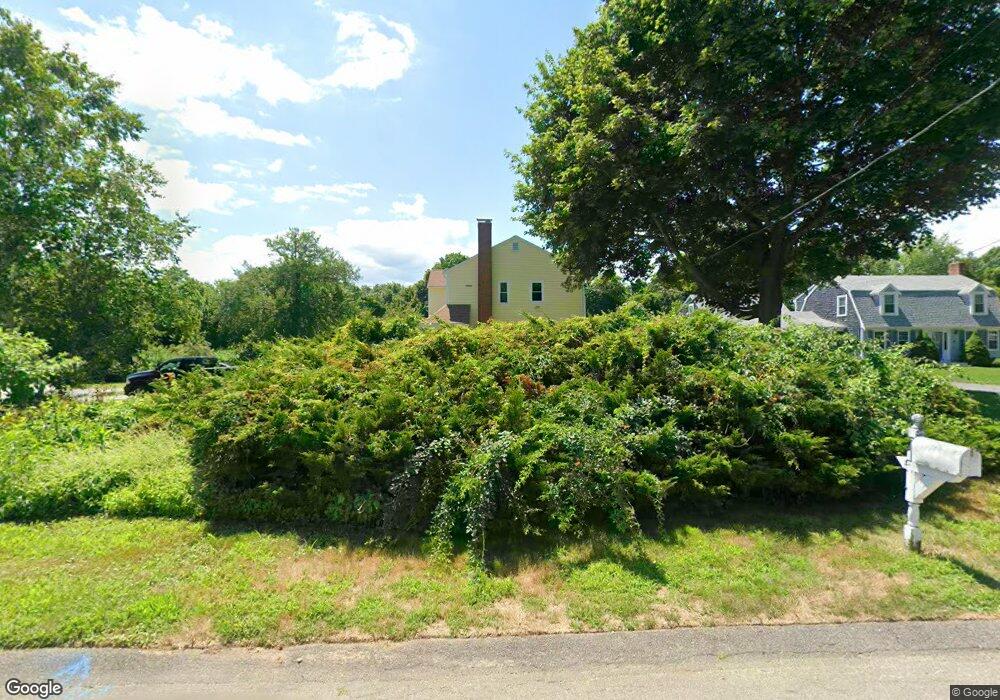
This home is located at 54 Leonard Rd, Marshfield, MA 02050 and is currently estimated at $976,786, approximately $424 per square foot. 54 Leonard Rd is a home located in Plymouth County with nearby schools including Governor Edward Winslow School, Furnace Brook Middle School, and Marshfield High School.
Ownership History
We collect this data history from publicly available records. To have your information removed, we recommend requesting removal directly through your county’s website.
Purchase Details
Home Financials for this Owner
Home Financials are based on the most recent Mortgage that was taken out on this home.Purchase Details
Home Values in the Area
Average Home Value in this Area
Purchase History
We collect this data history from publicly available records. To have your information removed, we recommend requesting removal directly through your county’s website.
| Date | Buyer | Sale Price | Title Company |
|---|---|---|---|
| $238,000 | -- | ||
| $174,000 | -- |
Mortgage History
We collect this data history from publicly available records. To have your information removed, we recommend requesting removal directly through your county’s website.
| Date | Status | Borrower | Loan Amount |
|---|---|---|---|
| Open | $150,000 | ||
| Closed | $64,599 | ||
| Closed | $137,000 | ||
| Previous Owner | $90,000 |
Tax History
We collect this data history from publicly available records. To have your information removed, we recommend requesting removal directly through your county’s website.
| Year | Tax Paid | Tax Assessment Tax Assessment Total Assessment is a certain percentage of the fair market value that is determined by local assessors to be the total taxable value of land and additions on the property. | Land | Improvement |
|---|---|---|---|---|
| 2025 | $6,980 | $705,100 | $303,800 | $401,300 |
| 2024 | $6,796 | $654,100 | $289,300 | $364,800 |
| 2023 | $6,563 | $583,000 | $268,600 | $314,400 |
| 2022 | $6,563 | $506,800 | $237,600 | $269,200 |
| 2021 | $6,339 | $480,600 | $237,600 | $243,000 |
| 2020 | $6,045 | $453,500 | $217,000 | $236,500 |
| 2019 | $5,893 | $440,400 | $217,000 | $223,400 |
| 2018 | $5,829 | $436,000 | $217,000 | $219,000 |
| 2017 | $5,810 | $423,500 | $217,000 | $206,500 |
| 2016 | $5,692 | $410,100 | $217,000 | $193,100 |
| 2015 | $5,390 | $405,600 | $217,000 | $188,600 |
| 2014 | $5,355 | $402,900 | $217,000 | $185,900 |
Map
- 39 Everett St
- 643 Careswell St
- 245 Careswell St
- 40 Signal Hill Rd
- 145 Peterson Path
- 41 Constantine Dr
- 50 Blackmount Dr
- 1 Old Pilgrim Trail
- 36 Ocean Rd N
- 154 Partridge Brook Cir
- 156 Duck Hill Rd
- 46 Fairways Edge Dr
- 87 Duck Hill Rd
- 64 Central St
- 39 Bay Pond Rd
- 45 Red Gold Farm Rd
- 3 The Marshes
- 36 Ocean St
- 38 Ocean St
- 670 Webster St
Ask me questions while you tour the home.