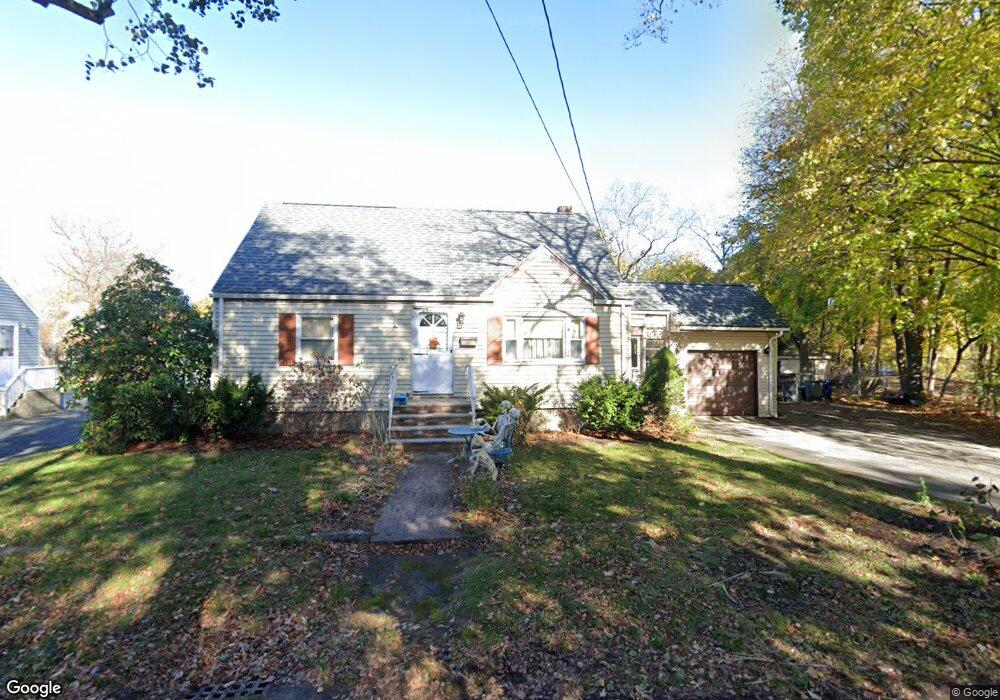
54 Linden Rd Peabody, MA 01960
South Peabody NeighborhoodEstimated Value: $590,000 - $704,000
3
Beds
2
Baths
1,152
Sq Ft
$548/Sq Ft
Est. Value
About This Home
This home is located at 54 Linden Rd, Peabody, MA 01960 and is currently estimated at $631,175, approximately $547 per square foot. 54 Linden Rd is a home located in Essex County with nearby schools including Peabody Veterans Memorial High School, North Shore Christian School, and St John The Baptist School.
Ownership History
Date
Name
Owned For
Owner Type
Purchase Details
Closed on
Dec 12, 1996
Sold by
Neary Anne F
Bought by
Neary Edward L
Current Estimated Value
Home Financials for this Owner
Home Financials are based on the most recent Mortgage that was taken out on this home.
Original Mortgage
$127,800
Outstanding Balance
$13,049
Interest Rate
7.75%
Mortgage Type
Purchase Money Mortgage
Estimated Equity
$618,126
Create a Home Valuation Report for This Property
The Home Valuation Report is an in-depth analysis detailing your home's value as well as a comparison with similar homes in the area
Home Values in the Area
Average Home Value in this Area
Purchase History
| Date | Buyer | Sale Price | Title Company |
|---|---|---|---|
| Neary Edward L | $142,000 | -- |
Source: Public Records
Mortgage History
| Date | Status | Borrower | Loan Amount |
|---|---|---|---|
| Open | Neary Edward L | $127,800 |
Source: Public Records
Tax History Compared to Growth
Tax History
| Year | Tax Paid | Tax Assessment Tax Assessment Total Assessment is a certain percentage of the fair market value that is determined by local assessors to be the total taxable value of land and additions on the property. | Land | Improvement |
|---|---|---|---|---|
| 2025 | $4,732 | $511,000 | $244,000 | $267,000 |
| 2024 | $4,469 | $490,000 | $244,000 | $246,000 |
| 2023 | $4,135 | $434,300 | $217,900 | $216,400 |
| 2022 | $4,109 | $406,800 | $194,600 | $212,200 |
| 2021 | $4,112 | $392,000 | $176,900 | $215,100 |
| 2020 | $3,977 | $370,300 | $176,900 | $193,400 |
| 2019 | $3,815 | $346,500 | $176,900 | $169,600 |
| 2018 | $3,628 | $316,600 | $160,800 | $155,800 |
| 2017 | $3,626 | $308,300 | $160,800 | $147,500 |
| 2016 | $3,526 | $295,800 | $160,800 | $135,000 |
| 2015 | $3,322 | $270,100 | $156,800 | $113,300 |
Source: Public Records
Map
Nearby Homes
- 30 Saint Ann's Ave
- 214 Lynn St
- 215A Lynn St
- 232 Lynn St
- 19 Cedar Grove Ave
- 41 Dexter St
- 60 Lynn St
- 292 Lynn St
- 16 Appleby Rd
- 74 Fairview Ave
- 17 Lions Ln
- 6 Countryside Ln Unit 1303
- 39 Graves Rd
- 2 Rose Cir
- 46 Diane Rd
- 2 Sophia Rd
- 21 Chanelle Cir
- 5 Quarry Terrace
- 12 Tanglewood Ln Unit 12
- 64 Spring View Dr