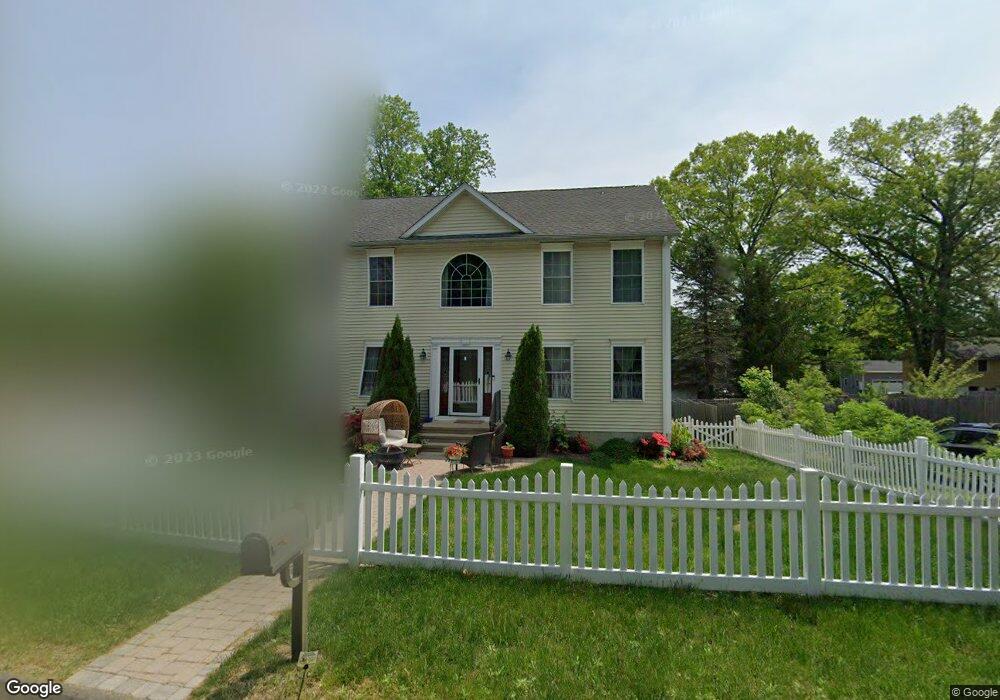
54 Locust St Trumbull, CT 06611
Estimated Value: $657,000 - $752,132
4
Beds
3
Baths
2,280
Sq Ft
$311/Sq Ft
Est. Value
About This Home
This home is located at 54 Locust St, Trumbull, CT 06611 and is currently estimated at $708,283, approximately $310 per square foot. 54 Locust St is a home located in Fairfield County with nearby schools including Middlebrook School, Madison Middle School, and Trumbull High School.
Ownership History
Date
Name
Owned For
Owner Type
Purchase Details
Closed on
Aug 31, 2004
Sold by
Baywood Dev Llc
Bought by
Khatri Sanjay and Khatri Ruma
Current Estimated Value
Home Financials for this Owner
Home Financials are based on the most recent Mortgage that was taken out on this home.
Original Mortgage
$375,000
Interest Rate
6.02%
Purchase Details
Closed on
Feb 6, 2004
Sold by
Lampart Cynthia
Bought by
Baywood Dev Inc
Create a Home Valuation Report for This Property
The Home Valuation Report is an in-depth analysis detailing your home's value as well as a comparison with similar homes in the area
Home Values in the Area
Average Home Value in this Area
Purchase History
| Date | Buyer | Sale Price | Title Company |
|---|---|---|---|
| Khatri Sanjay | $539,900 | -- | |
| Baywood Dev Inc | $179,900 | -- | |
| Khatri Sanjay | $539,900 | -- |
Source: Public Records
Mortgage History
| Date | Status | Borrower | Loan Amount |
|---|---|---|---|
| Open | Baywood Dev Inc | $267,000 | |
| Closed | Baywood Dev Inc | $360,000 | |
| Closed | Baywood Dev Inc | $375,000 |
Source: Public Records
Tax History
| Year | Tax Paid | Tax Assessment Tax Assessment Total Assessment is a certain percentage of the fair market value that is determined by local assessors to be the total taxable value of land and additions on the property. | Land | Improvement |
|---|---|---|---|---|
| 2025 | $12,045 | $327,810 | $135,730 | $192,080 |
| 2024 | $11,705 | $327,810 | $135,730 | $192,080 |
| 2023 | $11,518 | $327,810 | $135,730 | $192,080 |
| 2022 | $11,332 | $327,810 | $135,730 | $192,080 |
| 2021 | $10,354 | $284,760 | $113,120 | $171,640 |
| 2020 | $10,156 | $284,760 | $113,120 | $171,640 |
| 2018 | $9,928 | $284,760 | $113,120 | $171,640 |
| 2017 | $9,744 | $284,760 | $113,120 | $171,640 |
| 2016 | $9,494 | $284,760 | $113,120 | $171,640 |
| 2015 | $9,793 | $292,600 | $113,100 | $179,500 |
| 2014 | $9,586 | $292,600 | $113,100 | $179,500 |
Source: Public Records
Map
Nearby Homes
- 253 Mayfield Dr Unit 253
- 177 Mayfield Dr
- Lot 31 Valley View Rd
- 215 Fernwood Rd
- 40 Rose Terrace
- 21 Rexview Cir
- 94 Grove St
- 26 Grove St
- 546 Church Hill Rd
- 30 Windy Ridge
- 15 Glenarden Rd
- 0 Main St
- 5385 Main St
- 58 Daniels Farm Rd
- 39 Zephyr Rd
- 15 Squire Ct
- 184 Putting Green Rd
- 25 Plymouth Ave
- 877 White Plains Rd
- 699 Daniels Farm Rd
Your Personal Tour Guide
Ask me questions while you tour the home.