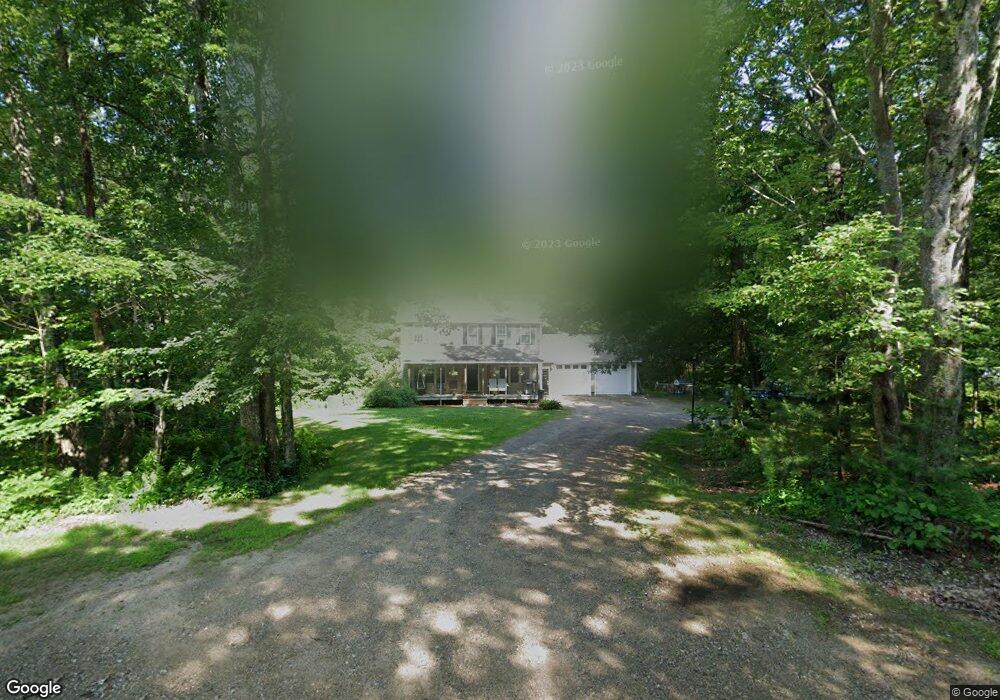
54 Morrison Rd Springvale, ME 04083
Estimated Value: $403,213 - $422,000
3
Beds
2
Baths
1,664
Sq Ft
$245/Sq Ft
Est. Value
About This Home
This home is located at 54 Morrison Rd, Springvale, ME 04083 and is currently estimated at $408,303, approximately $245 per square foot. 54 Morrison Rd is a home located in York County.
Ownership History
Date
Name
Owned For
Owner Type
Purchase Details
Closed on
Jul 12, 2021
Sold by
Phillips Mark L and Phillips Gina M
Bought by
Daney Kaitlin A
Current Estimated Value
Home Financials for this Owner
Home Financials are based on the most recent Mortgage that was taken out on this home.
Original Mortgage
$132,000
Outstanding Balance
$119,249
Interest Rate
2.9%
Mortgage Type
Purchase Money Mortgage
Estimated Equity
$289,054
Purchase Details
Closed on
Feb 8, 2017
Sold by
Bighorn Development Llc
Bought by
Phillips Mark L and Phillips Gina M
Purchase Details
Closed on
Nov 22, 2006
Sold by
Bighorn Dev Llc
Bought by
Paquette Alice P
Purchase Details
Closed on
May 24, 2005
Sold by
Berube Roger
Bought by
Bighorn Dev Llc
Create a Home Valuation Report for This Property
The Home Valuation Report is an in-depth analysis detailing your home's value as well as a comparison with similar homes in the area
Home Values in the Area
Average Home Value in this Area
Purchase History
| Date | Buyer | Sale Price | Title Company |
|---|---|---|---|
| Daney Kaitlin A | -- | None Available | |
| Phillips Mark L | -- | -- | |
| Paquette Alice P | -- | -- | |
| Bighorn Dev Llc | -- | -- |
Source: Public Records
Mortgage History
| Date | Status | Borrower | Loan Amount |
|---|---|---|---|
| Open | Daney Kaitlin A | $132,000 |
Source: Public Records
Tax History
| Year | Tax Paid | Tax Assessment Tax Assessment Total Assessment is a certain percentage of the fair market value that is determined by local assessors to be the total taxable value of land and additions on the property. | Land | Improvement |
|---|---|---|---|---|
| 2025 | $5,451 | $318,800 | $45,800 | $273,000 |
| 2024 | $5,145 | $318,800 | $45,800 | $273,000 |
| 2023 | $4,786 | $316,100 | $45,800 | $270,300 |
| 2022 | $4,678 | $316,100 | $45,800 | $270,300 |
| 2021 | $4,505 | $247,800 | $45,800 | $202,000 |
| 2020 | $4,278 | $212,200 | $46,000 | $166,200 |
| 2019 | $4,179 | $201,900 | $46,000 | $155,900 |
| 2018 | $3,855 | $192,300 | $41,300 | $151,000 |
| 2017 | $3,771 | $181,800 | $41,300 | $140,500 |
| 2016 | $3,920 | $172,400 | $42,700 | $129,700 |
| 2015 | $3,855 | $174,900 | $47,300 | $127,600 |
| 2014 | $4,015 | $176,600 | $49,000 | $127,600 |
| 2013 | -- | $185,700 | $55,100 | $130,600 |
Source: Public Records
Map
Nearby Homes
- TBD Elm St
- 5 Heidi St
- 5 Goodwin St
- 45 Payne St
- 39 Payne St
- 2 Kirk St
- 11 Nathan Ct
- 446 Main St
- 6 Harris St
- 14 Pleasant St
- 3 George St
- 5 Allenson St
- 27 Weeman St
- R6-41-S3 Railroad Ave
- R6-41-S2 Railroad Ave
- R6-41-S4 Railroad Ave
- 51 Pleasant St
- 538 Main St Unit 2
- 21 Signal St Unit I-3
- 17 Signal St Unit I-1
Your Personal Tour Guide
Ask me questions while you tour the home.