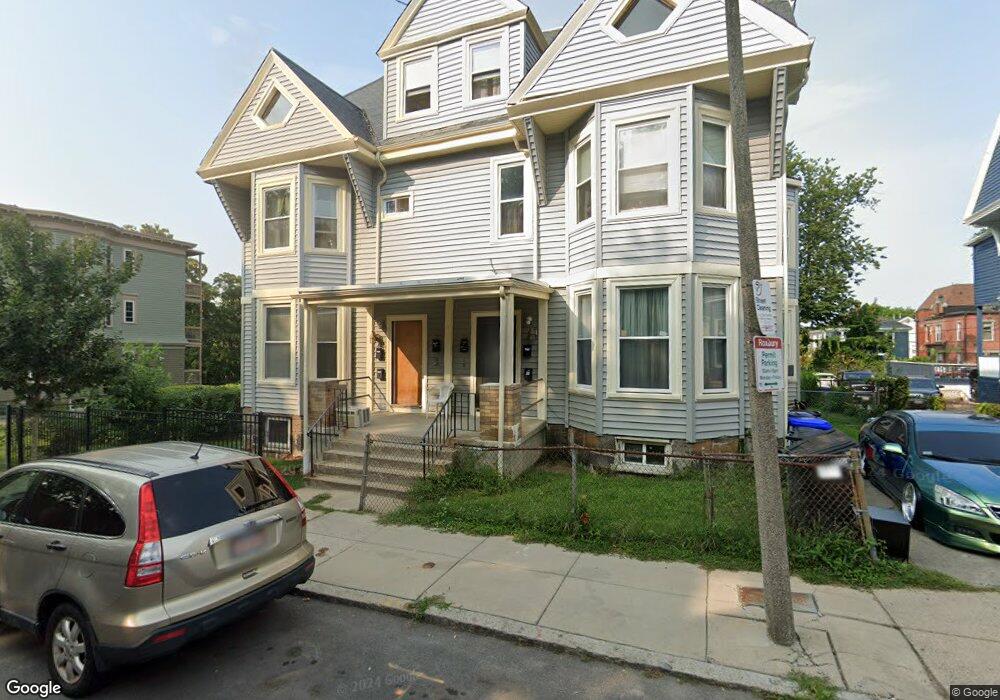
54 Mount Pleasant Ave Roxbury, MA 02119
Sav-Mor NeighborhoodEstimated Value: $976,000 - $1,217,000
5
Beds
3
Baths
2,895
Sq Ft
$379/Sq Ft
Est. Value
About This Home
This home is located at 54 Mount Pleasant Ave, Roxbury, MA 02119 and is currently estimated at $1,098,000, approximately $379 per square foot. 54 Mount Pleasant Ave is a home located in Suffolk County with nearby schools including Dudley Street Neighborhood Charter School.
Ownership History
Date
Name
Owned For
Owner Type
Purchase Details
Closed on
Jul 29, 2024
Sold by
Latimore Patricia A
Bought by
Patricia A Latimore Ret and Latimore
Current Estimated Value
Purchase Details
Closed on
Mar 25, 2019
Sold by
Apreala Bourdillon and Latimore Patricia A
Bought by
Apreala Latimore Lt and Apreala
Purchase Details
Closed on
Apr 3, 2009
Sold by
Spann Lessie
Bought by
Latimore Francina
Home Financials for this Owner
Home Financials are based on the most recent Mortgage that was taken out on this home.
Original Mortgage
$207,178
Interest Rate
4.92%
Mortgage Type
Commercial
Create a Home Valuation Report for This Property
The Home Valuation Report is an in-depth analysis detailing your home's value as well as a comparison with similar homes in the area
Home Values in the Area
Average Home Value in this Area
Purchase History
| Date | Buyer | Sale Price | Title Company |
|---|---|---|---|
| Patricia A Latimore Ret | -- | None Available | |
| Latimore Patricia A | -- | None Available | |
| Patricia A Latimore Ret | -- | None Available | |
| Latimore Patricia A | -- | None Available | |
| Apreala Latimore Lt | -- | -- | |
| Apreala Latimore Lt | -- | -- | |
| Latimore Francina | $211,000 | -- | |
| Latimore Francina | $211,000 | -- |
Source: Public Records
Mortgage History
| Date | Status | Borrower | Loan Amount |
|---|---|---|---|
| Previous Owner | Latimore Francina | $154,000 | |
| Previous Owner | Latimore Francina | $207,178 |
Source: Public Records
Tax History Compared to Growth
Tax History
| Year | Tax Paid | Tax Assessment Tax Assessment Total Assessment is a certain percentage of the fair market value that is determined by local assessors to be the total taxable value of land and additions on the property. | Land | Improvement |
|---|---|---|---|---|
| 2025 | $9,221 | $796,300 | $262,400 | $533,900 |
| 2024 | $8,371 | $768,000 | $223,200 | $544,800 |
| 2023 | $7,853 | $731,200 | $212,500 | $518,700 |
| 2022 | $7,577 | $696,400 | $202,400 | $494,000 |
| 2021 | $6,880 | $644,800 | $187,400 | $457,400 |
| 2020 | $5,811 | $550,300 | $186,000 | $364,300 |
| 2019 | $5,180 | $491,500 | $138,300 | $353,200 |
| 2018 | $4,769 | $455,100 | $138,300 | $316,800 |
| 2017 | $4,820 | $455,100 | $138,300 | $316,800 |
| 2016 | $4,353 | $395,700 | $138,300 | $257,400 |
| 2015 | $3,760 | $310,500 | $114,000 | $196,500 |
| 2014 | $3,646 | $289,800 | $114,000 | $175,800 |
Source: Public Records
Map
Nearby Homes
- 2 Mount Pleasant Place Unit 2
- 80 Mount Pleasant Ave
- 268 Dudley St Unit 4
- 101 Mount Pleasant Ave
- 80 Winthrop St Unit 2
- 108 Mount Pleasant Ave Unit 108R
- 91 Zeigler St
- 22-22A Montrose St
- 33 Copeland Park Unit C
- 33 Copeland Park Unit F
- 10 Taber St Unit 501
- 10 Taber St Unit 603
- 30 Copeland St Unit 1
- 37 Regent St Unit 2
- 24 Clarence St Unit 24R
- 7 Langford Park Unit 3
- 80 Blue Hill Ave Unit 5
- 64 Alpine St Unit 304
- 64 Alpine St Unit 104
- 59 Perrin St Unit 1
- 52 Mount Pleasant Ave
- 56 Mount Pleasant Ave
- 42 Mount Pleasant Ave
- 42 Mt Pleasant Ave Unit 3
- 42 Mt Pleasant Ave Unit 1
- 42 Mount Pleasant Ave Unit 1
- 42 Mount Pleasant Ave Unit 2
- 42 Mount Pleasant Ave Unit 3
- 58 Mount Pleasant Ave
- 40 Mount Pleasant Ave
- 40 Mount Pleasant Ave Unit 2
- 40 Mount Pleasant Ave Unit Ave
- 40 Mount Pleasant Ave Unit 1
- 60 Mount Pleasant Ave
- 19A Forest St
- 19 Forest St
- 72 Mount Pleasant Ave
- 70 Mount Pleasant Ave
- 17A Forest St
- 45 Mount Pleasant Ave