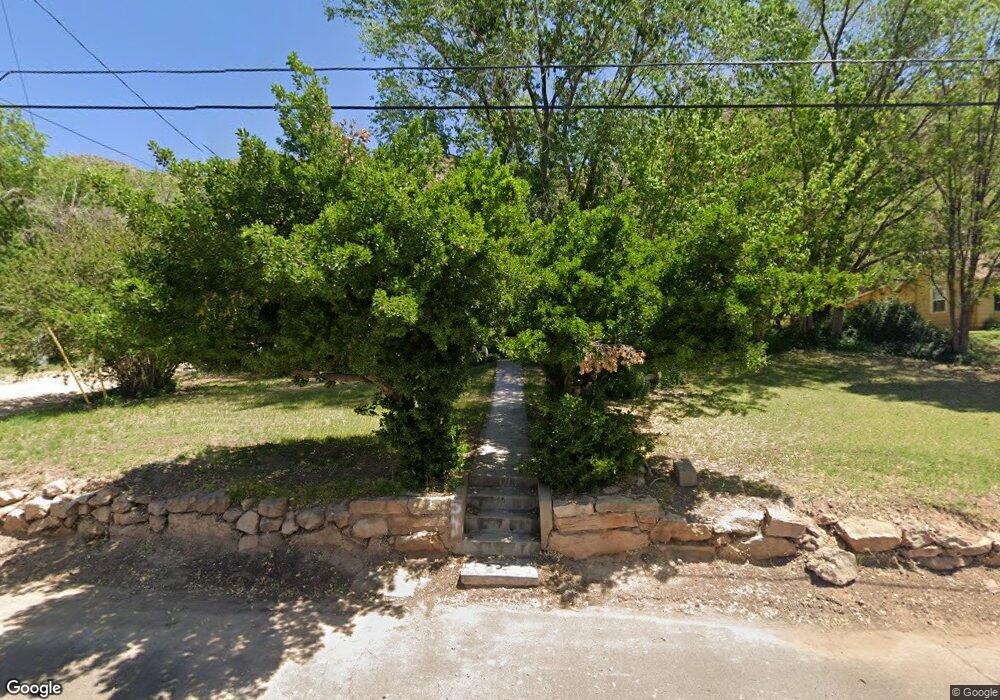
54 N 100 E La Verkin, UT 84745
Estimated Value: $272,000 - $339,000
1
Bed
1
Bath
771
Sq Ft
$394/Sq Ft
Est. Value
About This Home
This home is located at 54 N 100 E, La Verkin, UT 84745 and is currently estimated at $303,629, approximately $393 per square foot. 54 N 100 E is a home located in Washington County with nearby schools including La Verkin Elementary School, Hurricane Middle School, and Hurricane High School.
Ownership History
Date
Name
Owned For
Owner Type
Purchase Details
Closed on
Aug 22, 2024
Sold by
Stratton Christine Ann
Bought by
Christine Stratton Living Trust and Stratton
Current Estimated Value
Purchase Details
Closed on
Jun 24, 2024
Sold by
Stratton Christine Ann
Bought by
Christine Stratton Living Trust and Stratton
Purchase Details
Closed on
Jul 30, 2019
Sold by
Stratton Dale Dee and Stratton Christine Ann
Bought by
Gubler Murray Norman and Gubler Ann M
Purchase Details
Closed on
Jul 23, 2019
Sold by
Gubler Murray Norman and Gubler Ann M
Bought by
Stratton Dale Dee and Stratton Christine Ann
Purchase Details
Closed on
Nov 18, 2008
Sold by
Stratton Dale Dee and Stratton Christine Ann
Bought by
Gubler Norm
Purchase Details
Closed on
Oct 23, 2006
Sold by
Stratton Dale Dee
Bought by
Stratton Dale Dee and Stratton Christine Ann
Create a Home Valuation Report for This Property
The Home Valuation Report is an in-depth analysis detailing your home's value as well as a comparison with similar homes in the area
Home Values in the Area
Average Home Value in this Area
Purchase History
| Date | Buyer | Sale Price | Title Company |
|---|---|---|---|
| Christine Stratton Living Trust | -- | None Listed On Document | |
| Christine Stratton Living Trust | -- | None Listed On Document | |
| Gubler Murray Norman | -- | None Available | |
| Gubler Norman | -- | None Available | |
| La Verkin City | -- | None Available | |
| Stratton Dale Dee | -- | None Available | |
| Gubler Norm | -- | None Available | |
| Stratton Dale Dee | -- | None Available | |
| Stratton Dale Dee | -- | None Available |
Source: Public Records
Tax History
| Year | Tax Paid | Tax Assessment Tax Assessment Total Assessment is a certain percentage of the fair market value that is determined by local assessors to be the total taxable value of land and additions on the property. | Land | Improvement |
|---|---|---|---|---|
| 2025 | $1,154 | $146,190 | $91,080 | $55,110 |
| 2023 | $1,189 | $151,910 | $91,080 | $60,830 |
| 2022 | $1,071 | $129,745 | $61,765 | $67,980 |
| 2021 | $943 | $167,000 | $84,100 | $82,900 |
| 2020 | $913 | $150,700 | $84,100 | $66,600 |
| 2019 | $762 | $118,400 | $58,100 | $60,300 |
| 2018 | $742 | $60,190 | $0 | $0 |
| 2017 | $704 | $57,060 | $0 | $0 |
| 2016 | $680 | $52,935 | $0 | $0 |
| 2015 | $669 | $50,075 | $0 | $0 |
| 2014 | $643 | $47,435 | $0 | $0 |
Source: Public Records
Map
Nearby Homes
- 0 Lot #1 Valle Vista Unit 25-262463
- 0 Lot #2 Valle Vista Unit 25-262464
- 0 Lot #4 Valle Vista Unit 25-262467
- 0 Vista Unit 25-262466
- 161 E 130 N
- 728 N 15 W
- 235 N 200 E
- 235 N 200 E Unit 55
- 25 E 200 N
- 65 S Main St
- 80 W Center St Unit 13
- 353 N 200 E Unit 40
- 353 N 200 E
- 200 N State St
- 384 N 200 E
- 385 N 100 E
- 0 La Verkin Lot Unit 24-252790
- 402 N 200 E
- 402 N 200 E Unit 25
- 403 N 200 E
Your Personal Tour Guide
Ask me questions while you tour the home.