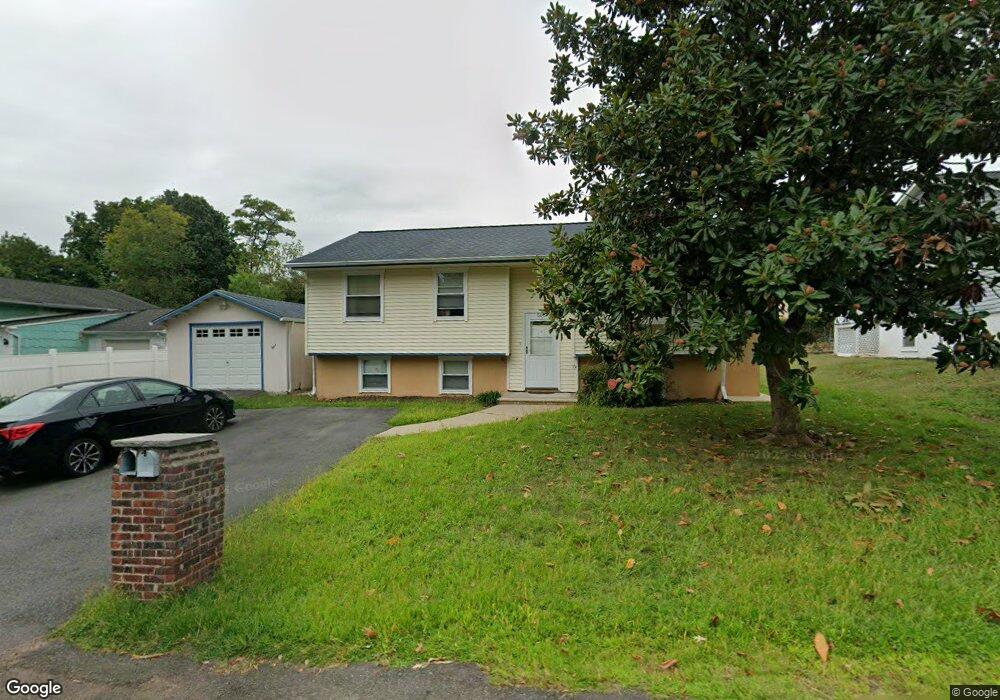
54 N Dover Ave Somerset, NJ 08873
Estimated Value: $405,473 - $454,000
--
Bed
--
Bath
958
Sq Ft
$452/Sq Ft
Est. Value
About This Home
This home is located at 54 N Dover Ave, Somerset, NJ 08873 and is currently estimated at $432,618, approximately $451 per square foot. 54 N Dover Ave is a home located in Somerset County with nearby schools including Franklin High School.
Ownership History
Date
Name
Owned For
Owner Type
Purchase Details
Closed on
Sep 26, 2003
Sold by
Huff Roger
Bought by
Cole Abdoulie M
Current Estimated Value
Home Financials for this Owner
Home Financials are based on the most recent Mortgage that was taken out on this home.
Original Mortgage
$223,725
Outstanding Balance
$105,976
Interest Rate
6.43%
Estimated Equity
$326,642
Purchase Details
Closed on
Jul 26, 1996
Sold by
Ruffin James
Bought by
Huff Roger
Home Financials for this Owner
Home Financials are based on the most recent Mortgage that was taken out on this home.
Original Mortgage
$133,000
Interest Rate
7.89%
Mortgage Type
FHA
Create a Home Valuation Report for This Property
The Home Valuation Report is an in-depth analysis detailing your home's value as well as a comparison with similar homes in the area
Home Values in the Area
Average Home Value in this Area
Purchase History
| Date | Buyer | Sale Price | Title Company |
|---|---|---|---|
| Cole Abdoulie M | $235,500 | -- | |
| Huff Roger | $145,000 | -- |
Source: Public Records
Mortgage History
| Date | Status | Borrower | Loan Amount |
|---|---|---|---|
| Open | Cole Abdoulie M | $223,725 | |
| Previous Owner | Huff Roger | $133,000 |
Source: Public Records
Tax History Compared to Growth
Tax History
| Year | Tax Paid | Tax Assessment Tax Assessment Total Assessment is a certain percentage of the fair market value that is determined by local assessors to be the total taxable value of land and additions on the property. | Land | Improvement |
|---|---|---|---|---|
| 2025 | $6,013 | $383,200 | $214,800 | $168,400 |
| 2024 | $6,013 | $330,000 | $214,800 | $115,200 |
| 2023 | $6,014 | $310,000 | $194,800 | $115,200 |
| 2022 | $5,734 | $280,000 | $164,800 | $115,200 |
| 2021 | $5,260 | $240,000 | $124,800 | $115,200 |
| 2020 | $5,260 | $230,000 | $114,800 | $115,200 |
| 2019 | $4,868 | $210,000 | $94,800 | $115,200 |
| 2018 | $4,918 | $210,000 | $94,800 | $115,200 |
| 2017 | $5,055 | $215,000 | $99,800 | $115,200 |
| 2016 | $5,216 | $220,000 | $104,800 | $115,200 |
| 2015 | $4,898 | $208,000 | $92,800 | $115,200 |
| 2014 | $4,849 | $209,000 | $93,800 | $115,200 |
Source: Public Records
Map
Nearby Homes