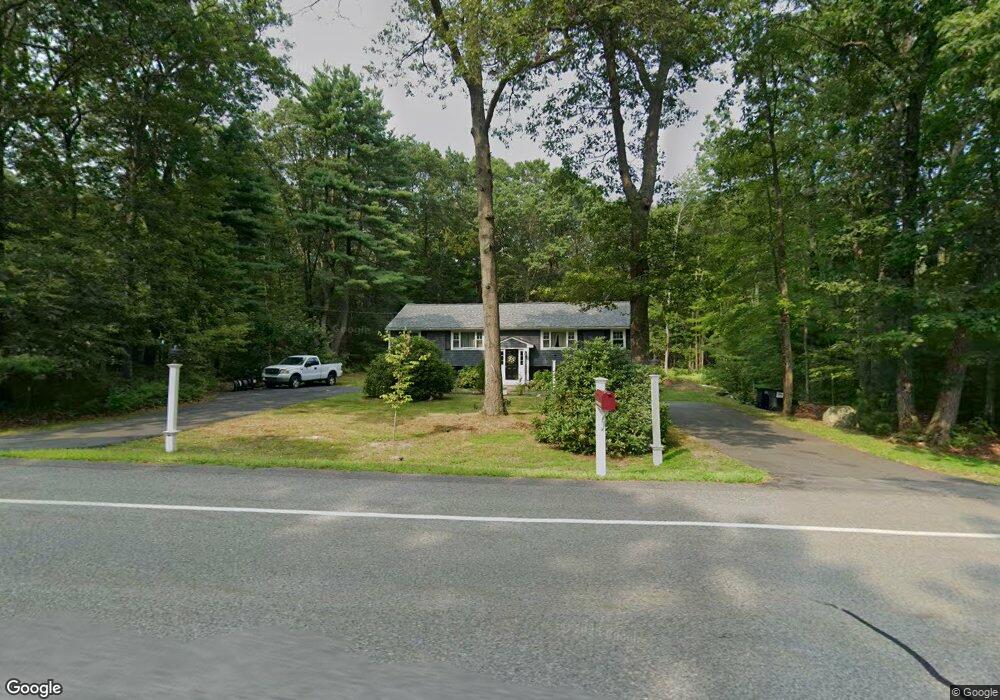
54 N Grove St Foxboro, MA 02035
Estimated Value: $610,000 - $681,000
4
Beds
3
Baths
1,442
Sq Ft
$452/Sq Ft
Est. Value
About This Home
This home is located at 54 N Grove St, Foxboro, MA 02035 and is currently estimated at $651,237, approximately $451 per square foot. 54 N Grove St is a home located in Norfolk County with nearby schools including Foxborough High School, Hands-On-Montessori School, and St Mary's Catholic School.
Ownership History
Date
Name
Owned For
Owner Type
Purchase Details
Closed on
Jan 23, 2023
Sold by
Oleary Edward T and Pomarico Nora
Bought by
Pomarico Nora
Current Estimated Value
Purchase Details
Closed on
Feb 6, 2013
Sold by
Oleary Madeline P Est
Bought by
Oleary Edward T and Berard Nora
Purchase Details
Closed on
Feb 21, 1980
Bought by
Oleary Edward T and Nora Berard
Create a Home Valuation Report for This Property
The Home Valuation Report is an in-depth analysis detailing your home's value as well as a comparison with similar homes in the area
Home Values in the Area
Average Home Value in this Area
Purchase History
| Date | Buyer | Sale Price | Title Company |
|---|---|---|---|
| Pomarico Nora | -- | None Available | |
| Oleary Edward T | -- | -- | |
| Oleary Edward T | -- | -- | |
| Oleary Edward T | $53,000 | -- |
Source: Public Records
Tax History Compared to Growth
Tax History
| Year | Tax Paid | Tax Assessment Tax Assessment Total Assessment is a certain percentage of the fair market value that is determined by local assessors to be the total taxable value of land and additions on the property. | Land | Improvement |
|---|---|---|---|---|
| 2025 | $7,394 | $559,300 | $267,800 | $291,500 |
| 2024 | $7,195 | $532,600 | $267,300 | $265,300 |
| 2023 | $7,035 | $495,100 | $254,900 | $240,200 |
| 2022 | $6,663 | $458,900 | $244,200 | $214,700 |
| 2021 | $6,145 | $416,900 | $222,500 | $194,400 |
| 2020 | $5,730 | $393,300 | $222,500 | $170,800 |
| 2019 | $5,579 | $379,500 | $212,100 | $167,400 |
| 2018 | $5,429 | $372,600 | $212,100 | $160,500 |
| 2017 | $5,273 | $350,600 | $198,500 | $152,100 |
| 2016 | $5,215 | $351,900 | $191,400 | $160,500 |
| 2015 | $4,956 | $326,300 | $162,400 | $163,900 |
| 2014 | $4,845 | $323,200 | $159,300 | $163,900 |
Source: Public Records
Map
Nearby Homes
- 406 South St
- 80 Mill St
- 450 West St
- 16 Treasure Island Rd
- 24 Maverick Dr
- 356 Central St
- 4 Buckskin Dr
- 12 Spring St
- 9 Oak Dr
- 166 Chauncy St
- 231 Spring St
- 483 Thurston St
- 22 Pleasant St Unit C
- 28 Angell St
- 150 Gilbert St
- 42 Angell St
- 44 Angell St Unit 44
- 116 George St
- 11 W Belcher Rd Unit 2
- 28 Court St