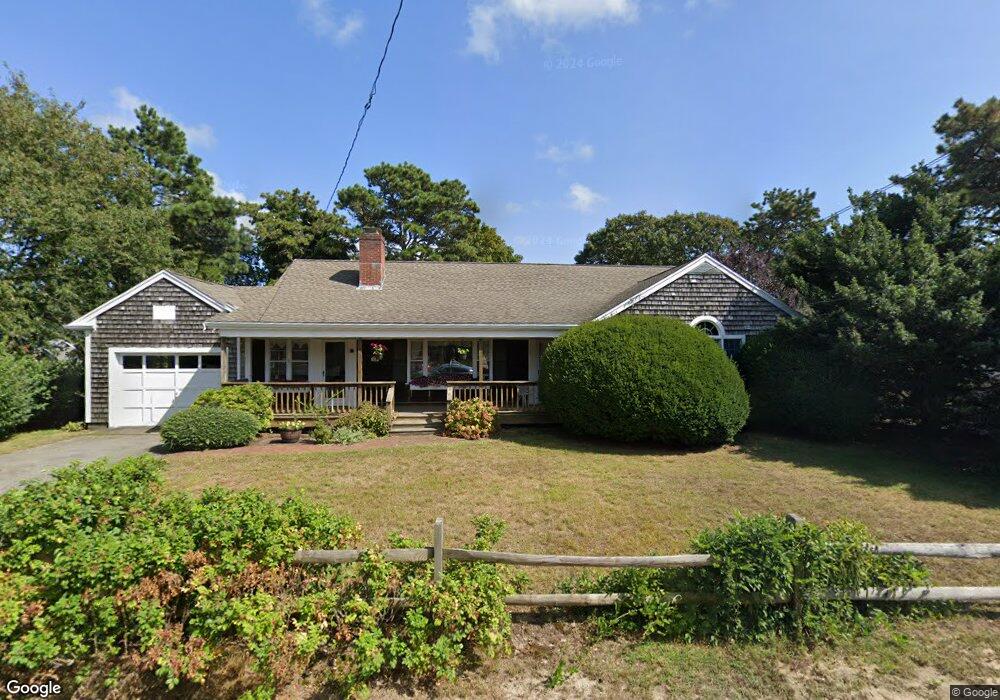
54 Ocean Dr Dennis Port, MA 02639
Dennis Port NeighborhoodEstimated Value: $592,000 - $884,000
2
Beds
2
Baths
1,652
Sq Ft
$475/Sq Ft
Est. Value
About This Home
This home is located at 54 Ocean Dr, Dennis Port, MA 02639 and is currently estimated at $784,745, approximately $475 per square foot. 54 Ocean Dr is a home located in Barnstable County with nearby schools including Dennis-Yarmouth Regional High School and St. Pius X. School.
Ownership History
Date
Name
Owned For
Owner Type
Purchase Details
Closed on
Dec 14, 2020
Sold by
Uppvall Richard J
Bought by
J Uppvall Jr T R
Current Estimated Value
Create a Home Valuation Report for This Property
The Home Valuation Report is an in-depth analysis detailing your home's value as well as a comparison with similar homes in the area
Home Values in the Area
Average Home Value in this Area
Purchase History
| Date | Buyer | Sale Price | Title Company |
|---|---|---|---|
| J Uppvall Jr T R | -- | None Available |
Source: Public Records
Tax History Compared to Growth
Tax History
| Year | Tax Paid | Tax Assessment Tax Assessment Total Assessment is a certain percentage of the fair market value that is determined by local assessors to be the total taxable value of land and additions on the property. | Land | Improvement |
|---|---|---|---|---|
| 2025 | $3,293 | $760,500 | $237,100 | $523,400 |
| 2024 | $3,205 | $730,100 | $228,000 | $502,100 |
| 2023 | $3,100 | $663,800 | $207,300 | $456,500 |
| 2022 | $2,809 | $501,600 | $163,400 | $338,200 |
| 2021 | $2,676 | $443,800 | $160,200 | $283,600 |
| 2020 | $2,547 | $417,500 | $160,200 | $257,300 |
| 2019 | $2,501 | $405,300 | $170,500 | $234,800 |
| 2018 | $2,365 | $373,000 | $162,300 | $210,700 |
| 2017 | $2,174 | $353,500 | $149,500 | $204,000 |
| 2016 | $2,017 | $308,900 | $141,000 | $167,900 |
| 2015 | $1,977 | $308,900 | $141,000 | $167,900 |
| 2014 | $1,907 | $300,300 | $132,400 | $167,900 |
Source: Public Records
Map
Nearby Homes
- 37 Ocean Dr Unit 2
- 64 Beaten Rd
- 112 Old Wharf Rd Unit E4
- 112 Old Wharf Rd Unit E1
- 120 Old Wharf Rd Unit 11
- 154 Old Wharf Rd Unit 26
- 154 Old Wharf Rd Unit 14
- 217 Old Wharf Rd Unit 64
- 6 Baker Way
- 80 Michaels Ave
- 241 Old Wharf Rd Unit 82
- 241 Old Wharf Rd Unit 127
- 241 Old Wharf Rd Unit 90
- 262 Old Wharf Rd Unit 67
- 262 Old Wharf Rd Unit 5
- 262 Old Wharf Rd Unit 5
- 262 Old Wharf Rd Unit 20
- 262 Old Wharf Rd Unit 87
- 31 Easy St
- 37 Beach Hills Rd