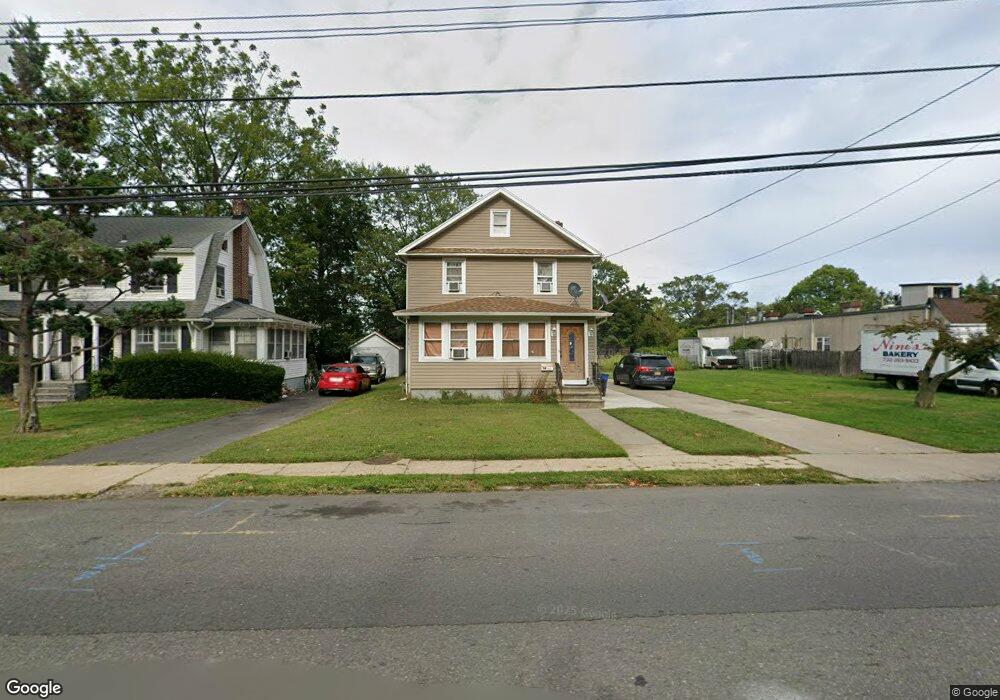
54 Oceanport Ave West Long Branch, NJ 07764
Estimated Value: $604,000 - $634,000
3
Beds
2
Baths
1,514
Sq Ft
$407/Sq Ft
Est. Value
About This Home
This home is located at 54 Oceanport Ave, West Long Branch, NJ 07764 and is currently estimated at $615,508, approximately $406 per square foot. 54 Oceanport Ave is a home located in Monmouth County with nearby schools including Betty McElmon Elementary School, Frank Antonides School, and Shore Regional High School.
Ownership History
Date
Name
Owned For
Owner Type
Purchase Details
Closed on
Jun 18, 2024
Sold by
Carr Enterprises Inc
Bought by
Carr Enterprises Inc
Current Estimated Value
Home Financials for this Owner
Home Financials are based on the most recent Mortgage that was taken out on this home.
Original Mortgage
$161,522
Outstanding Balance
$159,488
Interest Rate
7.09%
Mortgage Type
New Conventional
Estimated Equity
$456,020
Purchase Details
Closed on
Jun 3, 2024
Sold by
Oceanport Investments Llc
Bought by
Ace Realty Investments Llc
Home Financials for this Owner
Home Financials are based on the most recent Mortgage that was taken out on this home.
Original Mortgage
$161,522
Outstanding Balance
$159,488
Interest Rate
7.09%
Mortgage Type
New Conventional
Estimated Equity
$456,020
Purchase Details
Closed on
Sep 3, 2004
Sold by
Ercolino Gerard
Bought by
Oceanport Investments Llc
Create a Home Valuation Report for This Property
The Home Valuation Report is an in-depth analysis detailing your home's value as well as a comparison with similar homes in the area
Home Values in the Area
Average Home Value in this Area
Purchase History
| Date | Buyer | Sale Price | Title Company |
|---|---|---|---|
| Carr Enterprises Inc | -- | Us Title Solutions | |
| Ace Realty Investments Llc | $215,363 | Prestige Title | |
| Ace Realty Investments Llc | $215,363 | Prestige Title | |
| Oceanport Investments Llc | $350,000 | -- |
Source: Public Records
Mortgage History
| Date | Status | Borrower | Loan Amount |
|---|---|---|---|
| Open | Ace Realty Investments Llc | $161,522 | |
| Closed | Ace Realty Investments Llc | $161,522 |
Source: Public Records
Tax History Compared to Growth
Tax History
| Year | Tax Paid | Tax Assessment Tax Assessment Total Assessment is a certain percentage of the fair market value that is determined by local assessors to be the total taxable value of land and additions on the property. | Land | Improvement |
|---|---|---|---|---|
| 2025 | $7,329 | $583,500 | $400,700 | $182,800 |
| 2024 | $6,425 | $562,500 | $369,000 | $193,500 |
| 2023 | $6,425 | $459,900 | $270,900 | $189,000 |
| 2022 | $6,318 | $428,300 | $248,400 | $179,900 |
| 2021 | $6,318 | $327,100 | $167,100 | $160,000 |
| 2020 | $6,186 | $301,000 | $144,600 | $156,400 |
| 2019 | $6,416 | $313,900 | $158,400 | $155,500 |
| 2018 | $6,005 | $283,800 | $135,500 | $148,300 |
| 2017 | $5,992 | $270,400 | $126,600 | $143,800 |
| 2016 | $5,990 | $275,800 | $135,700 | $140,100 |
| 2015 | $5,920 | $272,200 | $135,700 | $136,500 |
| 2014 | $6,413 | $275,100 | $144,900 | $130,200 |
Source: Public Records
Map
Nearby Homes
- 56 Oceanport Ave
- 58 Oceanport Ave
- 65 Victor Ave
- 67 Victor Ave
- 63 Victor Ave
- 61 Victor Ave
- 71 Victor Ave
- 51 Oceanport Ave
- 55 Oceanport Ave
- 55 Oceanport Ave Unit B
- 49 Oceanport Ave
- 45 Oceanport Ave
- 73 Victor Ave
- 57 Oceanport Ave
- 64 Oceanport Ave
- 42 Rear Oceanport Ave
- 42 Oceanport Ave
- 59 Victor Ave
- 59 Oceanport Ave
- 42 Victor Ave