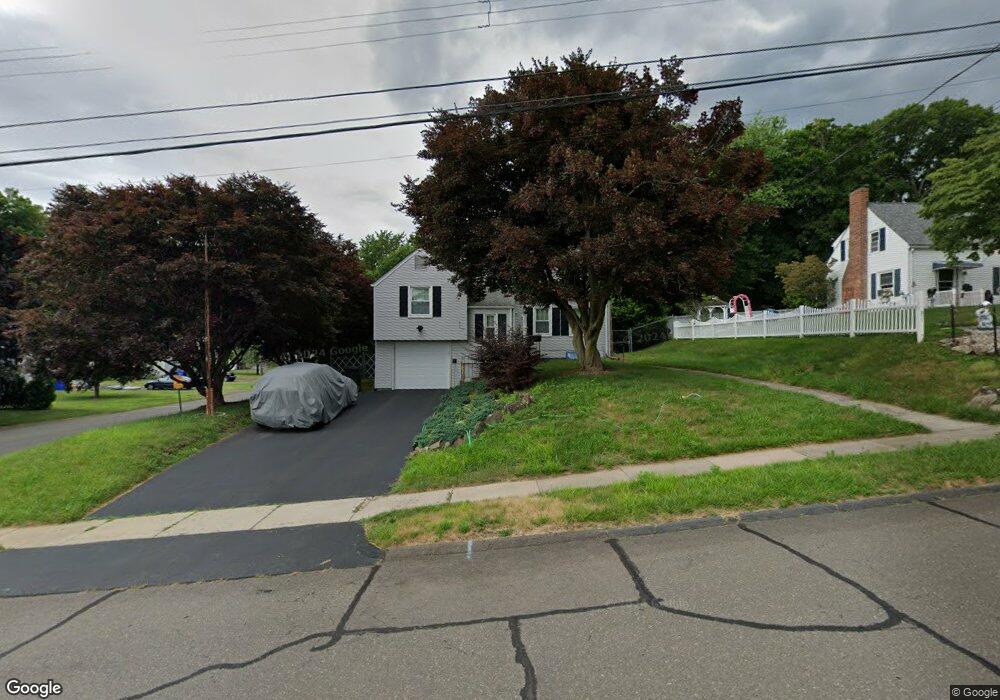
54 Onlook Rd Wethersfield, CT 06109
Estimated Value: $350,000 - $400,386
3
Beds
1
Bath
1,400
Sq Ft
$269/Sq Ft
Est. Value
About This Home
This home is located at 54 Onlook Rd, Wethersfield, CT 06109 and is currently estimated at $376,347, approximately $268 per square foot. 54 Onlook Rd is a home located in Hartford County with nearby schools including Emerson-Williams School, Silas Deane Middle School, and Wethersfield High School.
Ownership History
Date
Name
Owned For
Owner Type
Purchase Details
Closed on
Sep 1, 2005
Sold by
Sampson Cindy A
Bought by
Nyanin Adwda P
Current Estimated Value
Home Financials for this Owner
Home Financials are based on the most recent Mortgage that was taken out on this home.
Original Mortgage
$184,000
Interest Rate
5.81%
Purchase Details
Closed on
Apr 20, 1998
Sold by
Noli Donna A and Noli Ronald M
Bought by
Sampson Cindy A and Sampsom John F
Create a Home Valuation Report for This Property
The Home Valuation Report is an in-depth analysis detailing your home's value as well as a comparison with similar homes in the area
Home Values in the Area
Average Home Value in this Area
Purchase History
| Date | Buyer | Sale Price | Title Company |
|---|---|---|---|
| Nyanin Adwda P | $238,000 | -- | |
| Sampson Cindy A | $130,500 | -- |
Source: Public Records
Mortgage History
| Date | Status | Borrower | Loan Amount |
|---|---|---|---|
| Open | Sampson Cindy A | $184,000 | |
| Closed | Sampson Cindy A | $184,000 | |
| Closed | Sampson Cindy A | $25,000 | |
| Previous Owner | Sampson Cindy A | $192,160 |
Source: Public Records
Tax History
| Year | Tax Paid | Tax Assessment Tax Assessment Total Assessment is a certain percentage of the fair market value that is determined by local assessors to be the total taxable value of land and additions on the property. | Land | Improvement |
|---|---|---|---|---|
| 2025 | $10,101 | $245,040 | $98,000 | $147,040 |
| 2024 | $6,771 | $156,670 | $81,200 | $75,470 |
| 2023 | $6,541 | $156,570 | $81,200 | $75,370 |
| 2022 | $6,432 | $156,570 | $81,200 | $75,370 |
| 2021 | $6,368 | $156,570 | $81,200 | $75,370 |
| 2020 | $6,371 | $156,570 | $81,200 | $75,370 |
| 2019 | $6,379 | $156,570 | $81,200 | $75,370 |
| 2018 | $6,390 | $156,700 | $70,900 | $85,800 |
| 2017 | $6,232 | $156,700 | $70,900 | $85,800 |
| 2016 | $6,039 | $156,700 | $70,900 | $85,800 |
| 2015 | $5,984 | $156,700 | $70,900 | $85,800 |
| 2014 | $5,757 | $156,700 | $70,900 | $85,800 |
Source: Public Records
Map
Nearby Homes
- 20 Forest Dr
- 273 Forest Dr
- 173 Timber Trail
- 35 Kingston St
- 116 Wells Farm Dr
- 295 Ridge Rd Unit 8
- 249 Ridge Rd
- 104 Willow St
- 39 Schoolhouse Crossing
- 1 Bristol St
- 7 Barrington Dr Unit C
- 19 Albert Ave
- 1310 Berlin Turnpike Unit 223
- 455 Brimfield Rd
- 137 Dale Rd
- 192 Wolcott Hill Rd
- 250 Edward St
- 274 Cedarwood Ln
- 89 Merriman Rd
- 90 Goodwin Park Rd
Your Personal Tour Guide
Ask me questions while you tour the home.