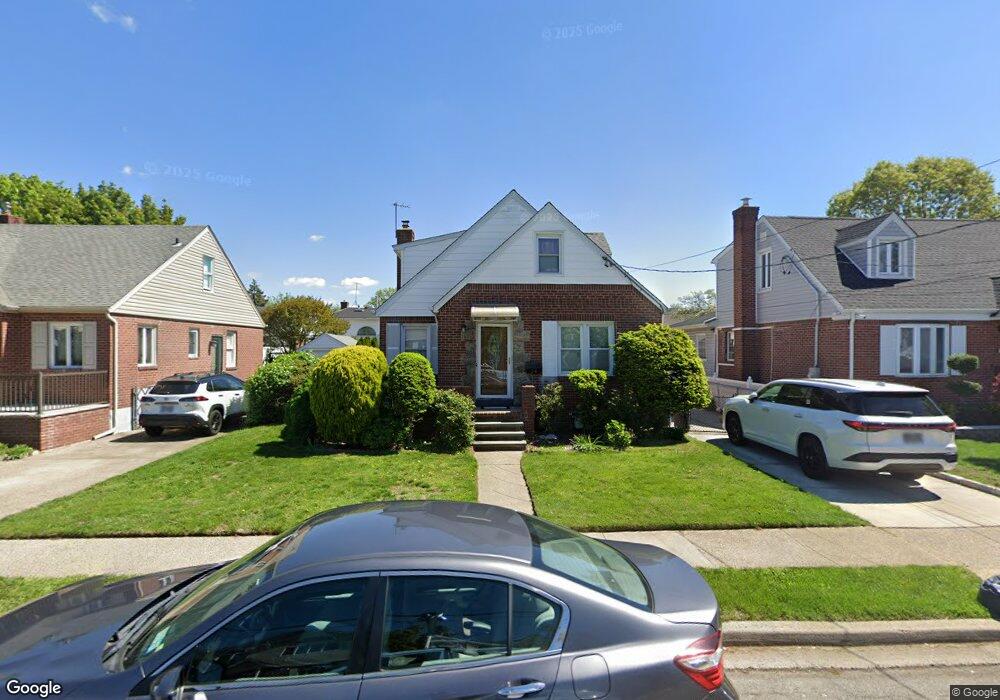
54 Paul Ave New Hyde Park, NY 11040
Estimated Value: $898,000 - $929,255
--
Bed
2
Baths
1,414
Sq Ft
$646/Sq Ft
Est. Value
About This Home
This home is located at 54 Paul Ave, New Hyde Park, NY 11040 and is currently estimated at $913,628, approximately $646 per square foot. 54 Paul Ave is a home located in Nassau County with nearby schools including Notre Dame School.
Ownership History
Date
Name
Owned For
Owner Type
Purchase Details
Closed on
Sep 8, 2020
Sold by
George Silu and Eapan Smitha
Bought by
George Silu and Eapen Smitha
Current Estimated Value
Purchase Details
Closed on
Mar 23, 2015
Sold by
Chacko Manjumol A and Kuruvilla Rejimon
Bought by
George Silu and Eapen Smitha
Home Financials for this Owner
Home Financials are based on the most recent Mortgage that was taken out on this home.
Original Mortgage
$417,000
Outstanding Balance
$320,203
Interest Rate
3.75%
Mortgage Type
New Conventional
Estimated Equity
$593,425
Purchase Details
Closed on
Sep 23, 2010
Sold by
Milcetic Paul and Milcetic Alba
Bought by
Kuruvilla Rejimon and Chacko Manjumol A
Home Financials for this Owner
Home Financials are based on the most recent Mortgage that was taken out on this home.
Original Mortgage
$376,000
Interest Rate
4.37%
Mortgage Type
Purchase Money Mortgage
Create a Home Valuation Report for This Property
The Home Valuation Report is an in-depth analysis detailing your home's value as well as a comparison with similar homes in the area
Home Values in the Area
Average Home Value in this Area
Purchase History
| Date | Buyer | Sale Price | Title Company |
|---|---|---|---|
| George Silu | -- | Chicago Title | |
| George Silu | $560,000 | First American Title | |
| Kuruvilla Rejimon | $470,000 | -- |
Source: Public Records
Mortgage History
| Date | Status | Borrower | Loan Amount |
|---|---|---|---|
| Open | George Silu | $417,000 | |
| Previous Owner | Kuruvilla Rejimon | $376,000 |
Source: Public Records
Tax History Compared to Growth
Tax History
| Year | Tax Paid | Tax Assessment Tax Assessment Total Assessment is a certain percentage of the fair market value that is determined by local assessors to be the total taxable value of land and additions on the property. | Land | Improvement |
|---|---|---|---|---|
| 2025 | $14,627 | $669 | $336 | $333 |
| 2024 | $4,494 | $669 | $336 | $333 |
| 2023 | $14,457 | $669 | $336 | $333 |
| 2022 | $14,457 | $669 | $336 | $333 |
| 2021 | $14,714 | $657 | $330 | $327 |
| 2020 | $15,297 | $1,054 | $710 | $344 |
| 2019 | $13,378 | $1,054 | $710 | $344 |
| 2018 | $13,378 | $1,054 | $0 | $0 |
| 2017 | $8,715 | $1,054 | $710 | $344 |
| 2016 | $12,579 | $1,054 | $710 | $344 |
| 2015 | $3,677 | $1,054 | $710 | $344 |
| 2014 | $3,677 | $1,054 | $710 | $344 |
| 2013 | $3,495 | $1,054 | $710 | $344 |
Source: Public Records
Map
Nearby Homes