Estimated Value: $92,000 - $127,000
2
Beds
1
Bath
800
Sq Ft
$130/Sq Ft
Est. Value
About This Home
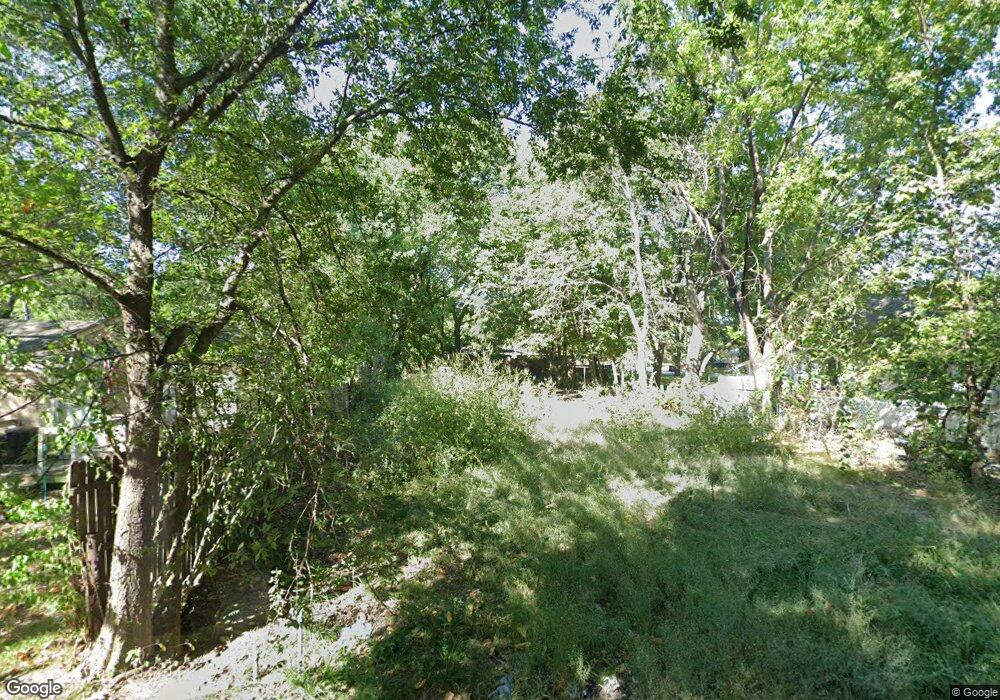
This home is located at 54 Pine St, Pryor, OK 74361 and is currently estimated at $104,000, approximately $130 per square foot. 54 Pine St is a home located in Mayes County with nearby schools including Pryor Middle School, Pryor High School, and William Bradford Christian School.
Ownership History
Date
Name
Owned For
Owner Type
Purchase Details
Closed on
Aug 1, 2025
Sold by
Lackey Scott Hamilton and Lynse Faye
Bought by
Carrillo Pilar and Barajas Abel Carrillo
Current Estimated Value
Purchase Details
Closed on
Dec 19, 2024
Sold by
Holeman Michael and Holeman Tina
Bought by
Lackey Scott Hamilton and Lackey Lynse Faye
Purchase Details
Closed on
Jun 12, 2023
Sold by
Mayes Circuit Court
Bought by
Martin Alva
Purchase Details
Closed on
Mar 27, 2019
Sold by
King Sharon
Bought by
Harris English Dutial
Purchase Details
Closed on
May 18, 2011
Sold by
Minor Ross D and Minor Cleta M
Bought by
King Jimmy R and King Sharon
Purchase Details
Closed on
Jun 7, 1997
Sold by
Gushwa Glen K
Bought by
Minor Ross D
Purchase Details
Closed on
Sep 5, 1990
Sold by
Weaver John
Bought by
Gushwa Glen K
Purchase Details
Closed on
Jul 11, 1990
Sold by
Steffey George
Bought by
Weaver John
Create a Home Valuation Report for This Property
The Home Valuation Report is an in-depth analysis detailing your home's value as well as a comparison with similar homes in the area
Purchase History
| Date | Buyer | Sale Price | Title Company |
|---|---|---|---|
| Carrillo Pilar | $8,000 | Mayes County Abstract | |
| Lackey Scott Hamilton | $8,000 | None Listed On Document | |
| Lackey Scott Hamilton | $8,000 | None Listed On Document | |
| Martin Alva | -- | None Listed On Document | |
| Harris English Dutial | $15,000 | None Available | |
| King Jimmy R | -- | None Available | |
| Minor Ross D | $3,900 | -- | |
| Gushwa Glen K | $5,000 | -- | |
| Weaver John | $8,000 | -- |
Source: Public Records
Tax History
| Year | Tax Paid | Tax Assessment Tax Assessment Total Assessment is a certain percentage of the fair market value that is determined by local assessors to be the total taxable value of land and additions on the property. | Land | Improvement |
|---|---|---|---|---|
| 2025 | $192 | $2,268 | $2,268 | $0 |
| 2024 | $192 | $3,616 | $1,890 | $1,726 |
| 2023 | $305 | $2,425 | $1,039 | $1,386 |
| 2022 | $193 | $2,310 | $960 | $1,350 |
| 2021 | $186 | $2,199 | $869 | $1,330 |
| 2020 | $176 | $2,123 | $895 | $1,228 |
| 2019 | $175 | $2,047 | $869 | $1,178 |
| 2018 | $170 | $2,008 | $869 | $1,139 |
| 2017 | $153 | $1,933 | $834 | $1,099 |
| 2016 | $147 | $1,841 | $811 | $1,030 |
| 2015 | $149 | $1,841 | $811 | $1,030 |
| 2014 | $149 | $1,841 | $811 | $1,030 |
Source: Public Records
Map
Nearby Homes
- 29 Pine St
- 25 Pine St
- 0 W Graham St Unit 2605787
- 404 N Maple St
- 15 S Mayes St
- 120 S Whitaker St
- 122 S Whitaker St
- 114 N Whitaker St
- 420 NW 5th St
- 201 S Taylor St
- 205 S Taylor St
- 0 W Highway 20
- 2 NW 5th St
- 215 W 481 Rd
- 245 W 481 Rd
- 4748 N 4318 Rd
- 187 W 481 Rd
- 157 W 481 Rd
- 335 N Taylor St
- 811 S Adair St
Your Personal Tour Guide
Ask me questions while you tour the home.