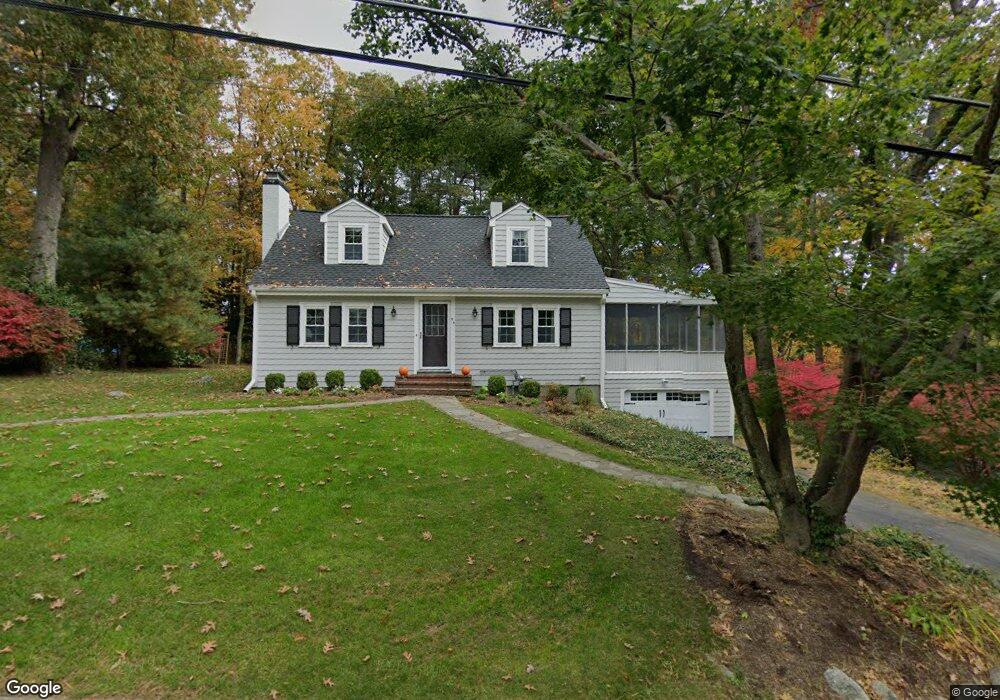
54 Pokonoket Ave Sudbury, MA 01776
Estimated Value: $782,448 - $898,000
3
Beds
2
Baths
2,022
Sq Ft
$418/Sq Ft
Est. Value
About This Home
This home is located at 54 Pokonoket Ave, Sudbury, MA 01776 and is currently estimated at $846,112, approximately $418 per square foot. 54 Pokonoket Ave is a home located in Middlesex County with nearby schools including Israel Loring Elementary School, Ephraim Curtis Middle School, and Lincoln-Sudbury Regional High School.
Ownership History
Date
Name
Owned For
Owner Type
Purchase Details
Closed on
Sep 19, 2013
Sold by
Ledebuhr Erich K and Ledebuhr Hilary R
Bought by
Ledebuhr Erich and Ledebuhr Ilary
Current Estimated Value
Purchase Details
Closed on
Dec 24, 2009
Sold by
Bartlett Josiah H and Bartlett Diane S
Bought by
Ledebuhr Erich K and Ledebuhr Hilary R
Home Financials for this Owner
Home Financials are based on the most recent Mortgage that was taken out on this home.
Original Mortgage
$362,400
Interest Rate
4.92%
Mortgage Type
Purchase Money Mortgage
Purchase Details
Closed on
Oct 13, 2006
Sold by
Zhang Dong and Liu Qiming
Bought by
Bartlett Diane S and Bartlett Josiah
Purchase Details
Closed on
Aug 13, 2004
Sold by
Johnson Georgiana W and Johnson Roy E
Bought by
Zhang Dong and Liu Qiming
Home Financials for this Owner
Home Financials are based on the most recent Mortgage that was taken out on this home.
Original Mortgage
$404,000
Interest Rate
6.16%
Mortgage Type
Purchase Money Mortgage
Create a Home Valuation Report for This Property
The Home Valuation Report is an in-depth analysis detailing your home's value as well as a comparison with similar homes in the area
Home Values in the Area
Average Home Value in this Area
Purchase History
| Date | Buyer | Sale Price | Title Company |
|---|---|---|---|
| Ledebuhr Erich | -- | -- | |
| Ledebuhr Erich K | $453,000 | -- | |
| Bartlett Diane S | $489,900 | -- | |
| Zhang Dong | $505,000 | -- |
Source: Public Records
Mortgage History
| Date | Status | Borrower | Loan Amount |
|---|---|---|---|
| Previous Owner | Ledebuhr Erich K | $362,400 | |
| Previous Owner | Zhang Dong | $404,000 |
Source: Public Records
Tax History Compared to Growth
Tax History
| Year | Tax Paid | Tax Assessment Tax Assessment Total Assessment is a certain percentage of the fair market value that is determined by local assessors to be the total taxable value of land and additions on the property. | Land | Improvement |
|---|---|---|---|---|
| 2025 | $9,895 | $675,900 | $410,100 | $265,800 |
| 2024 | $9,565 | $654,700 | $398,100 | $256,600 |
| 2023 | $9,752 | $618,400 | $368,500 | $249,900 |
| 2022 | $9,536 | $528,300 | $337,900 | $190,400 |
| 2021 | $9,332 | $495,600 | $337,900 | $157,700 |
| 2020 | $9,144 | $495,600 | $337,900 | $157,700 |
| 2019 | $8,876 | $495,600 | $337,900 | $157,700 |
| 2018 | $9,019 | $503,000 | $355,700 | $147,300 |
| 2017 | $8,691 | $489,900 | $351,500 | $138,400 |
| 2016 | $8,371 | $470,300 | $337,900 | $132,400 |
| 2015 | $8,020 | $455,700 | $324,800 | $130,900 |
| 2014 | $7,989 | $443,100 | $315,200 | $127,900 |
Source: Public Records
Map
Nearby Homes
- 23 Massasoit Ave
- 94 Goodmans Hill Rd
- 36 Concord Rd
- 216 Landham Rd
- 6 Old County Rd Unit 16
- 1011 Boston Post Rd
- 270 Old Lancaster Rd
- 0 Wagonwheel Rd
- 84 Hopestill Brown Rd
- 89 Bridle Path
- 63 Landham Rd
- 24 Woodland Rd
- 128 Nobscot Rd
- 25 Bridle Path
- 7 Adams Rd
- 23 Cider Mill Rd
- 427 Concord Rd
- 0 Robbins Rd
- 30 Nobscot Rd Unit 14
- 91 Eaton Rd W
- 50 Pokonoket Ave
- 55 Pokonoket Ave
- 60 Pokonoket Ave
- 59 Pokonoket Ave
- 15 Metacomet Way
- 64 Pokonoket Ave
- 35 Winsor Rd
- 23 Pokonoket Ave
- 65 Pokonoket Ave
- 25 Winsor Rd
- 37 Pokonoket Ave
- 21 Metacomet Way
- 27 Pokonoket Ave
- 69 Pokonoket Ave
- 12 Metacomet Way
- 20 Metacomet Way
- 22 Winsor Rd
- 76 Pokonoket Ave
- 36 Winsor Rd
- 21 Pokonoket Ave