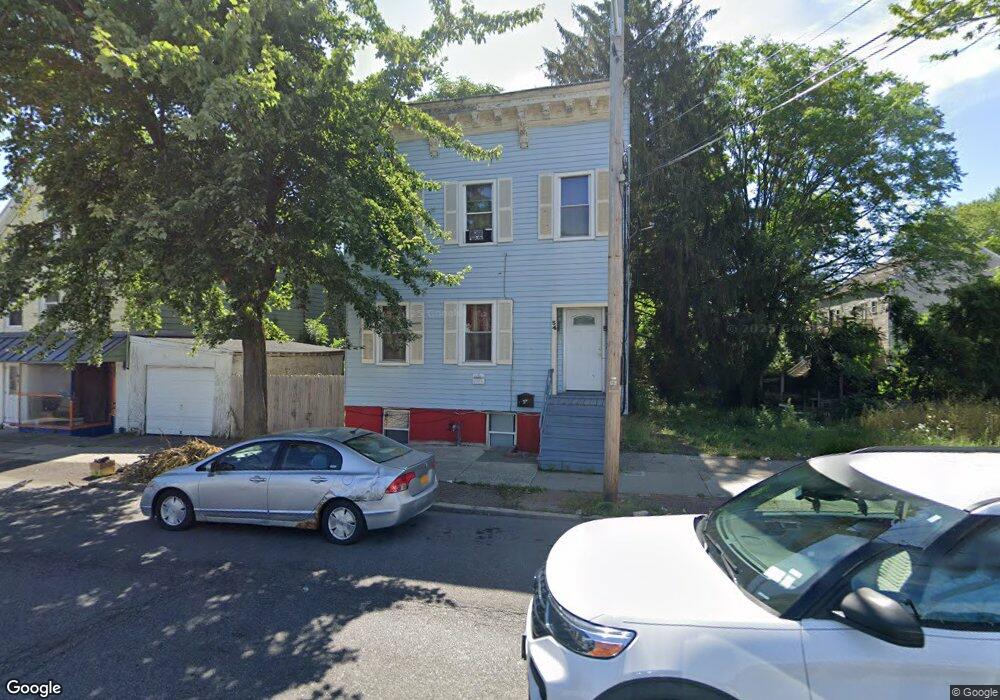
54 Quail St Albany, NY 12206
West Hill NeighborhoodEstimated Value: $159,000 - $192,000
6
Beds
3
Baths
2,736
Sq Ft
$65/Sq Ft
Est. Value
About This Home
This home is located at 54 Quail St, Albany, NY 12206 and is currently estimated at $178,667, approximately $65 per square foot. 54 Quail St is a home located in Albany County with nearby schools including Stephen And Harriet Myers Middle School, Roots Academy at West Hill, and Albany High School.
Ownership History
Date
Name
Owned For
Owner Type
Purchase Details
Closed on
Aug 6, 2014
Sold by
County Of Albany
Bought by
Matin Md Abdul
Current Estimated Value
Purchase Details
Closed on
Nov 30, 2006
Sold by
Marshall Ray
Bought by
Marshall & Sons Llc
Purchase Details
Closed on
Apr 18, 2006
Purchase Details
Closed on
Feb 9, 2006
Purchase Details
Closed on
Jun 12, 2003
Sold by
Cahill James
Bought by
Rhodan Donovan
Create a Home Valuation Report for This Property
The Home Valuation Report is an in-depth analysis detailing your home's value as well as a comparison with similar homes in the area
Home Values in the Area
Average Home Value in this Area
Purchase History
| Date | Buyer | Sale Price | Title Company |
|---|---|---|---|
| Matin Md Abdul | $21,000 | None Available | |
| Marshall & Sons Llc | -- | Kapital Title & Abstract Ser | |
| -- | $50,777 | -- | |
| Marshall Ray | $50,777 | Sneeringer Monahan Provost R | |
| -- | -- | -- | |
| Wells Fargo Bank | $77,000 | None Available | |
| Wells Fargo Bank Na | $55,000 | None Available | |
| Rhodan Donovan | $90,000 | -- |
Source: Public Records
Tax History
| Year | Tax Paid | Tax Assessment Tax Assessment Total Assessment is a certain percentage of the fair market value that is determined by local assessors to be the total taxable value of land and additions on the property. | Land | Improvement |
|---|---|---|---|---|
| 2024 | $3,813 | $136,000 | $27,200 | $108,800 |
| 2023 | $3,029 | $70,000 | $20,000 | $50,000 |
| 2022 | $2,878 | $70,000 | $20,000 | $50,000 |
| 2021 | $2,872 | $70,000 | $20,000 | $50,000 |
| 2020 | $2,846 | $75,000 | $20,000 | $55,000 |
| 2019 | $3,203 | $75,000 | $20,000 | $55,000 |
| 2018 | $3,296 | $75,000 | $20,000 | $55,000 |
| 2017 | $1,403 | $80,000 | $20,000 | $60,000 |
| 2016 | $3,192 | $80,000 | $20,000 | $60,000 |
| 2015 | $2,879 | $97,900 | $21,800 | $76,100 |
| 2014 | -- | $97,900 | $21,800 | $76,100 |
Source: Public Records
Map
Nearby Homes
Your Personal Tour Guide
Ask me questions while you tour the home.