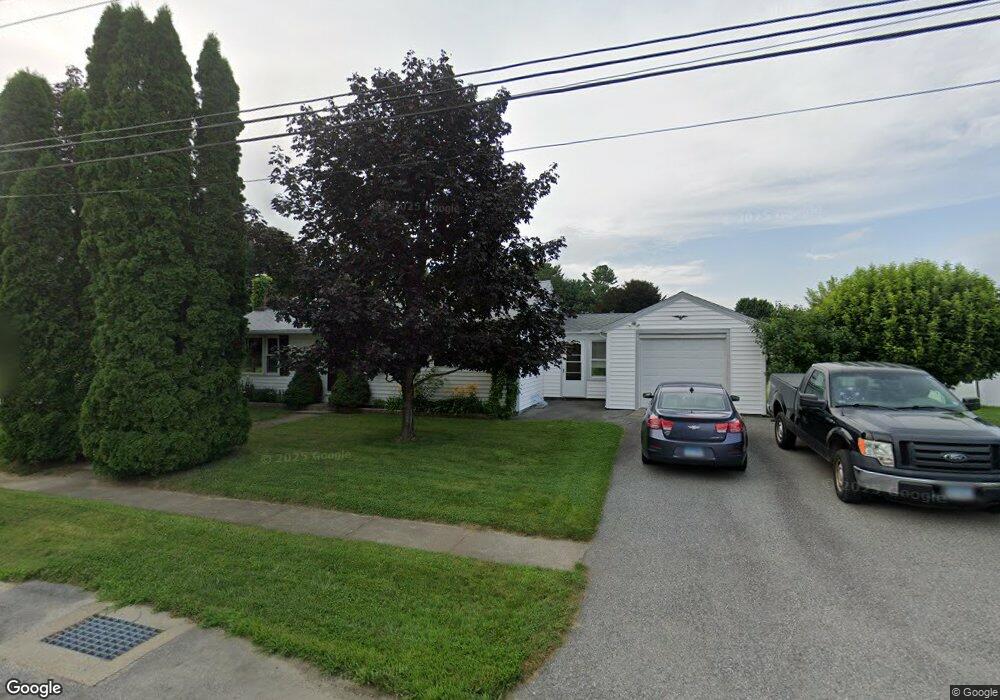
54 Rosedale St Danielson, CT 06239
Estimated Value: $285,000 - $316,000
2
Beds
1
Bath
1,008
Sq Ft
$297/Sq Ft
Est. Value
About This Home
This home is located at 54 Rosedale St, Danielson, CT 06239 and is currently estimated at $299,460, approximately $297 per square foot. 54 Rosedale St is a home located in Windham County with nearby schools including Killingly Central School, Killingly Memorial School, and Killingly Intermediate School.
Ownership History
Date
Name
Owned For
Owner Type
Purchase Details
Closed on
Nov 9, 2016
Sold by
Rocheleau Richard R and Rocheleau Patricia J
Bought by
Hint Melinda G and Imre Tina M
Current Estimated Value
Purchase Details
Closed on
Jan 23, 1998
Sold by
Wojcik Michael and Wojcik Bette A
Bought by
Rocheleau Richard R and Hardy Patricia J
Home Financials for this Owner
Home Financials are based on the most recent Mortgage that was taken out on this home.
Original Mortgage
$84,900
Interest Rate
7.11%
Mortgage Type
Unknown
Create a Home Valuation Report for This Property
The Home Valuation Report is an in-depth analysis detailing your home's value as well as a comparison with similar homes in the area
Home Values in the Area
Average Home Value in this Area
Purchase History
| Date | Buyer | Sale Price | Title Company |
|---|---|---|---|
| Hint Melinda G | -- | None Available | |
| Hint Melinda G | -- | None Available | |
| Hint Melinda G | -- | None Available | |
| Rocheleau Richard R | $85,000 | -- | |
| Rocheleau Richard R | $85,000 | -- |
Source: Public Records
Mortgage History
| Date | Status | Borrower | Loan Amount |
|---|---|---|---|
| Previous Owner | Rocheleau Richard R | $50,000 | |
| Previous Owner | Rocheleau Richard R | $84,900 |
Source: Public Records
Tax History Compared to Growth
Tax History
| Year | Tax Paid | Tax Assessment Tax Assessment Total Assessment is a certain percentage of the fair market value that is determined by local assessors to be the total taxable value of land and additions on the property. | Land | Improvement |
|---|---|---|---|---|
| 2025 | $3,252 | $140,310 | $28,760 | $111,550 |
| 2024 | $3,091 | $140,310 | $28,760 | $111,550 |
| 2023 | $2,880 | $99,120 | $23,730 | $75,390 |
| 2022 | $2,700 | $99,120 | $23,730 | $75,390 |
| 2021 | $2,700 | $99,120 | $23,730 | $75,390 |
| 2020 | $2,650 | $99,120 | $23,730 | $75,390 |
| 2019 | $2,682 | $99,120 | $23,730 | $75,390 |
| 2017 | $2,302 | $77,350 | $15,120 | $62,230 |
| 2016 | $2,302 | $77,350 | $15,120 | $62,230 |
| 2015 | $2,302 | $77,350 | $15,120 | $62,230 |
| 2014 | $2,240 | $77,350 | $15,120 | $62,230 |
Source: Public Records
Map
Nearby Homes