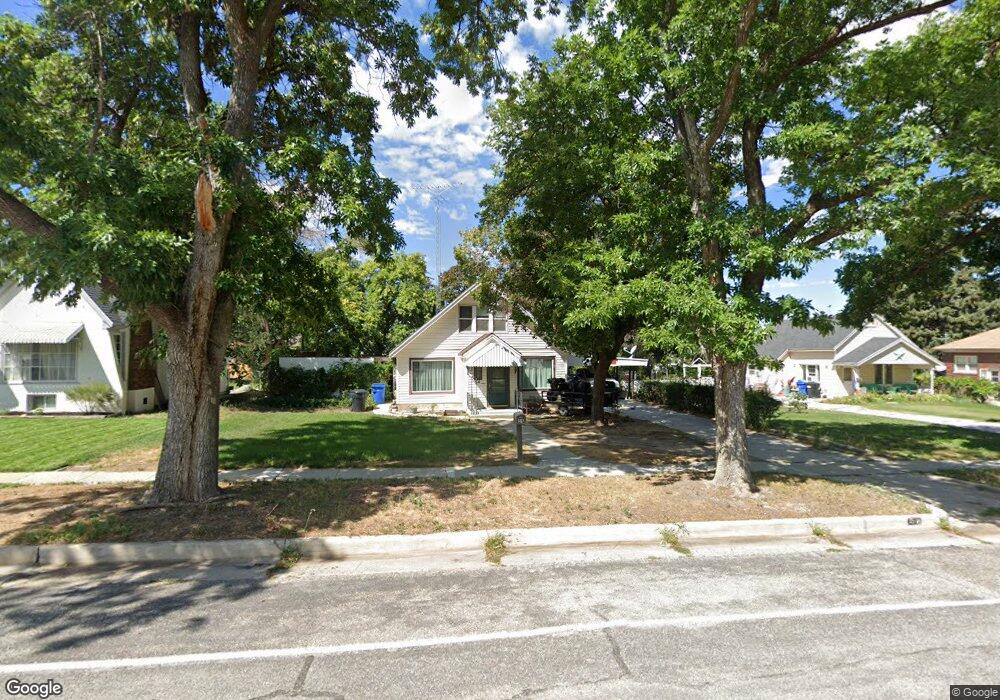
54 S 200 E Brigham City, UT 84302
Estimated Value: $345,313 - $403,000
4
Beds
2
Baths
1,718
Sq Ft
$215/Sq Ft
Est. Value
About This Home
This home is located at 54 S 200 E, Brigham City, UT 84302 and is currently estimated at $368,828, approximately $214 per square foot. 54 S 200 E is a home located in Box Elder County with nearby schools including Golden Spike Elementary, Box Elder Middle School, and Adele C. Young Intermediate School.
Ownership History
Date
Name
Owned For
Owner Type
Purchase Details
Closed on
Oct 31, 2025
Sold by
Hansen Paula J
Bought by
Hansen Martin Todd
Current Estimated Value
Home Financials for this Owner
Home Financials are based on the most recent Mortgage that was taken out on this home.
Original Mortgage
$79,000
Outstanding Balance
$79,000
Interest Rate
5.41%
Mortgage Type
New Conventional
Estimated Equity
$289,828
Purchase Details
Closed on
Sep 7, 2021
Sold by
Hansen Paula J
Bought by
Hansen Martin Todd
Home Financials for this Owner
Home Financials are based on the most recent Mortgage that was taken out on this home.
Original Mortgage
$181,000
Interest Rate
2.8%
Mortgage Type
New Conventional
Purchase Details
Closed on
May 24, 2019
Sold by
Hansen Paula J and Nelson Paula J
Bought by
Hansen Paula J
Home Financials for this Owner
Home Financials are based on the most recent Mortgage that was taken out on this home.
Original Mortgage
$134,500
Interest Rate
4.1%
Mortgage Type
Stand Alone Second
Purchase Details
Closed on
Oct 26, 2009
Sold by
Reyes Jeremy P and Reyes Brenda G
Bought by
Nelson Paula J
Home Financials for this Owner
Home Financials are based on the most recent Mortgage that was taken out on this home.
Original Mortgage
$114,320
Interest Rate
5.02%
Mortgage Type
New Conventional
Create a Home Valuation Report for This Property
The Home Valuation Report is an in-depth analysis detailing your home's value as well as a comparison with similar homes in the area
Purchase History
| Date | Buyer | Sale Price | Title Company |
|---|---|---|---|
| Hansen Martin Todd | -- | First American Title Insurance | |
| Hansen Martin Todd | -- | Hickman Land Title Logan | |
| Hansen Paula J | -- | Accommodation | |
| Nelson Paula J | -- | -- |
Source: Public Records
Mortgage History
| Date | Status | Borrower | Loan Amount |
|---|---|---|---|
| Open | Hansen Martin Todd | $79,000 | |
| Previous Owner | Hansen Martin Todd | $181,000 | |
| Previous Owner | Hansen Paula J | $134,500 | |
| Previous Owner | Nelson Paula J | $114,320 |
Source: Public Records
Tax History
| Year | Tax Paid | Tax Assessment Tax Assessment Total Assessment is a certain percentage of the fair market value that is determined by local assessors to be the total taxable value of land and additions on the property. | Land | Improvement |
|---|---|---|---|---|
| 2025 | $1,889 | $324,851 | $105,000 | $219,851 |
| 2024 | $1,650 | $317,615 | $100,000 | $217,615 |
| 2023 | $1,716 | $338,265 | $95,000 | $243,265 |
| 2022 | $1,666 | $167,907 | $22,000 | $145,907 |
| 2021 | $1,326 | $194,012 | $40,000 | $154,012 |
| 2020 | $1,194 | $194,012 | $40,000 | $154,012 |
| 2019 | $1,122 | $96,961 | $22,000 | $74,961 |
| 2018 | $1,014 | $87,184 | $22,000 | $65,184 |
| 2017 | $934 | $139,038 | $16,500 | $109,038 |
| 2016 | $978 | $73,615 | $16,500 | $57,115 |
| 2015 | $910 | $68,423 | $16,500 | $51,923 |
| 2014 | $910 | $0 | $0 | $0 |
| 2013 | -- | $65,951 | $16,500 | $49,451 |
Source: Public Records
Map
Nearby Homes
Your Personal Tour Guide
Ask me questions while you tour the home.