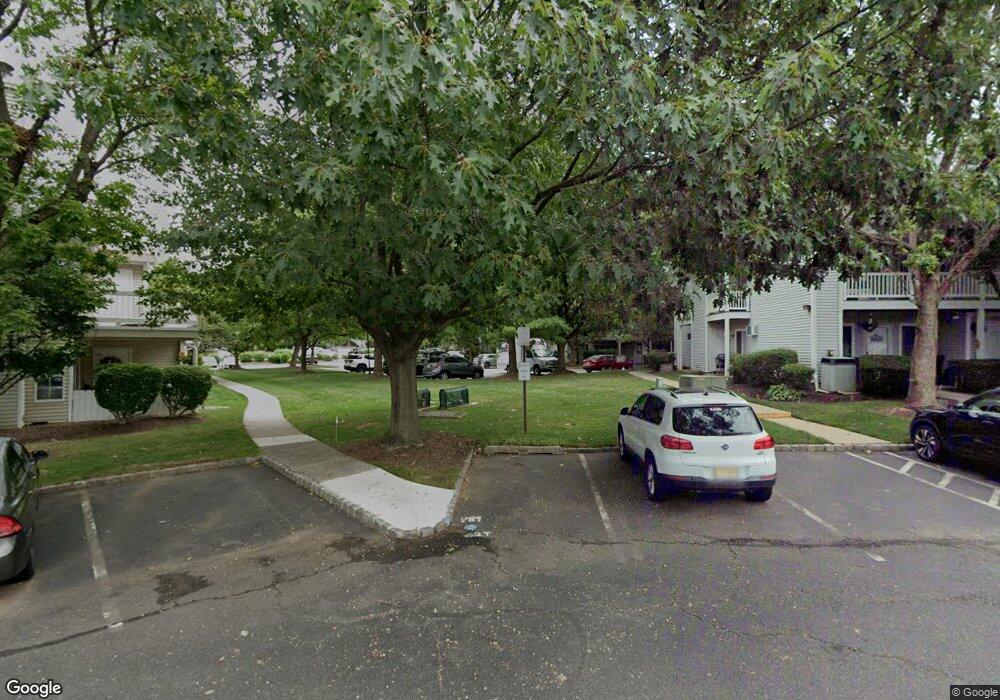
54 Sage Ct Bedminster, NJ 07921
Estimated Value: $327,594 - $372,000
--
Bed
--
Bath
762
Sq Ft
$454/Sq Ft
Est. Value
About This Home
This home is located at 54 Sage Ct, Bedminster, NJ 07921 and is currently estimated at $346,149, approximately $454 per square foot. 54 Sage Ct is a home located in Somerset County with nearby schools including Bedminster Township School, Guidepost Montessori at Bridgewater, and Far Hills Country Day School.
Ownership History
Date
Name
Owned For
Owner Type
Purchase Details
Closed on
May 23, 2001
Sold by
Izeppi Erwin
Bought by
Yendrick Dawn
Current Estimated Value
Home Financials for this Owner
Home Financials are based on the most recent Mortgage that was taken out on this home.
Original Mortgage
$142,200
Outstanding Balance
$53,176
Interest Rate
7.05%
Mortgage Type
FHA
Estimated Equity
$292,973
Purchase Details
Closed on
Jun 28, 1999
Sold by
Claffey Timothy
Bought by
Izeppi Erwin and Vargas Estela
Home Financials for this Owner
Home Financials are based on the most recent Mortgage that was taken out on this home.
Original Mortgage
$109,250
Interest Rate
7.19%
Purchase Details
Closed on
Apr 29, 1992
Sold by
Ross Lauren R
Bought by
Claffey Timothy J
Purchase Details
Closed on
Nov 13, 1990
Sold by
Preston Mary K
Bought by
Ross Lauren R
Create a Home Valuation Report for This Property
The Home Valuation Report is an in-depth analysis detailing your home's value as well as a comparison with similar homes in the area
Home Values in the Area
Average Home Value in this Area
Purchase History
| Date | Buyer | Sale Price | Title Company |
|---|---|---|---|
| Yendrick Dawn | $158,000 | -- | |
| Yendrick Dawn | $158,000 | -- | |
| Izeppi Erwin | $119,000 | -- | |
| Claffey Timothy J | $110,000 | -- | |
| Ross Lauren R | $102,000 | -- |
Source: Public Records
Mortgage History
| Date | Status | Borrower | Loan Amount |
|---|---|---|---|
| Open | Yendrick Dawn | $142,200 | |
| Closed | Yendrick Dawn | $142,200 | |
| Previous Owner | Izeppi Erwin | $109,250 |
Source: Public Records
Tax History Compared to Growth
Tax History
| Year | Tax Paid | Tax Assessment Tax Assessment Total Assessment is a certain percentage of the fair market value that is determined by local assessors to be the total taxable value of land and additions on the property. | Land | Improvement |
|---|---|---|---|---|
| 2025 | $3,504 | $309,200 | $150,000 | $159,200 |
| 2024 | $3,504 | $275,900 | $127,200 | $148,700 |
| 2023 | $3,455 | $257,800 | $117,800 | $140,000 |
| 2022 | $3,433 | $250,000 | $114,400 | $135,600 |
| 2021 | $3,365 | $241,200 | $110,000 | $131,200 |
| 2020 | $3,278 | $237,000 | $105,800 | $131,200 |
| 2019 | $3,201 | $232,800 | $100,800 | $132,000 |
| 2018 | $3,108 | $229,000 | $99,800 | $129,200 |
| 2017 | $3,169 | $229,800 | $94,300 | $135,500 |
| 2016 | $3,096 | $227,800 | $94,300 | $133,500 |
| 2015 | $2,987 | $219,800 | $87,500 | $132,300 |
| 2014 | $2,921 | $213,500 | $87,500 | $126,000 |
Source: Public Records
Map
Nearby Homes
- 66 Mountain Ct Unit 4766
- 41 Cambridge Rd
- 22 Tansy Ct
- 13 Eton Ct
- 9 Stone Run Rd
- 2 Berkley Ln
- 1002 Timberbrooke Dr
- 6 Ray Ct Unit 13706
- 15 Ray Ct
- 25 Spruce Ct
- 6 Wood Duck Pond Road Ondo
- 328 Enclave Ln
- 25 Stevens Ct
- 39 Academy Ct
- 22 Morgan Ct
- 10 Morgan Ct
- 971 Washington Valley Rd
- 14 Sussex Ct
- 21 Parkside Rd
- 4 Hansom Rd