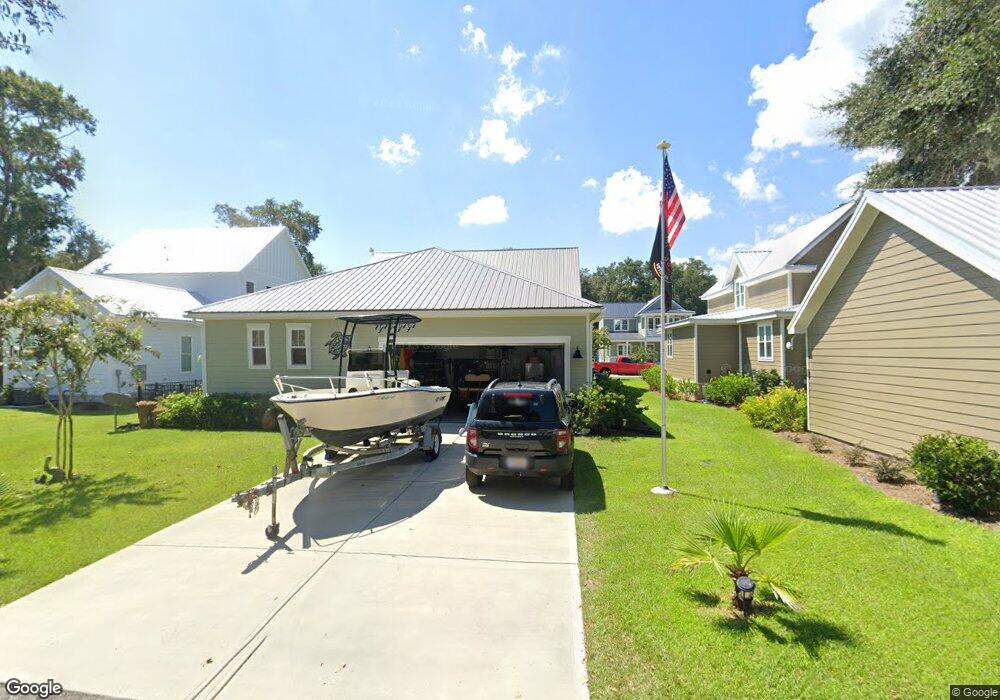
54 Salt Marsh Dr Midway, GA 31320
Estimated Value: $616,935 - $629,000
3
Beds
3
Baths
2,888
Sq Ft
$215/Sq Ft
Est. Value
About This Home
This home is located at 54 Salt Marsh Dr, Midway, GA 31320 and is currently estimated at $621,734, approximately $215 per square foot. 54 Salt Marsh Dr is a home located in Liberty County with nearby schools including Liberty Elementary School, Midway Middle School, and Liberty County High School.
Ownership History
Date
Name
Owned For
Owner Type
Purchase Details
Closed on
Apr 30, 2021
Sold by
C E Hall Inc
Bought by
Carlson Steven W and Carlson Denise M
Current Estimated Value
Home Financials for this Owner
Home Financials are based on the most recent Mortgage that was taken out on this home.
Original Mortgage
$262,820
Outstanding Balance
$237,674
Interest Rate
3.1%
Mortgage Type
FHA
Estimated Equity
$384,060
Purchase Details
Closed on
May 29, 2020
Sold by
The Yb Life Llc
Bought by
C E Hall Inc
Home Financials for this Owner
Home Financials are based on the most recent Mortgage that was taken out on this home.
Original Mortgage
$281,600
Interest Rate
3.2%
Mortgage Type
New Conventional
Purchase Details
Closed on
Jan 3, 2012
Sold by
Yellow Bluff Development Llc
Bought by
The Heritage Bank
Create a Home Valuation Report for This Property
The Home Valuation Report is an in-depth analysis detailing your home's value as well as a comparison with similar homes in the area
Home Values in the Area
Average Home Value in this Area
Purchase History
| Date | Buyer | Sale Price | Title Company |
|---|---|---|---|
| Carlson Steven W | $369,000 | -- | |
| C E Hall Inc | -- | -- | |
| The Heritage Bank | -- | -- |
Source: Public Records
Mortgage History
| Date | Status | Borrower | Loan Amount |
|---|---|---|---|
| Open | Carlson Steven W | $262,820 | |
| Previous Owner | C E Hall Inc | $281,600 |
Source: Public Records
Tax History Compared to Growth
Tax History
| Year | Tax Paid | Tax Assessment Tax Assessment Total Assessment is a certain percentage of the fair market value that is determined by local assessors to be the total taxable value of land and additions on the property. | Land | Improvement |
|---|---|---|---|---|
| 2024 | $4,398 | $243,860 | $28,000 | $215,860 |
| 2023 | $4,398 | $217,266 | $28,000 | $189,266 |
| 2022 | $5,732 | $168,061 | $16,000 | $152,061 |
| 2021 | $5,380 | $138,975 | $8,000 | $130,975 |
| 2020 | $539 | $14,000 | $14,000 | $0 |
| 2019 | $525 | $14,000 | $14,000 | $0 |
| 2018 | $519 | $14,000 | $14,000 | $0 |
| 2017 | $461 | $14,000 | $14,000 | $0 |
| 2016 | $483 | $14,000 | $14,000 | $0 |
| 2015 | $314 | $6,500 | $6,500 | $0 |
| 2014 | $314 | $9,000 | $9,000 | $0 |
| 2013 | -- | $29,750 | $29,750 | $0 |
Source: Public Records
Map
Nearby Homes
- Lot 2 Yellow Bluff Rd
- Lot 30 Yellow Bluff Rd
- 54 Salt Marsh Dr
- 36 Salt Marsh Dr
- 123 Yellow Bluff Dr
- Lot 87 Oyster Point Dr
- Lot 52 Salt Marsh Dr
- 49 Salt Marsh Dr
- Lot 18 Yellow Bluff Dr
- Lot 10 Marina Dr
- 121 Salt Marsh Dr
- Lot 7 Marina Dr
- 149 Marina Dr
- 181 Yellow Bluff Rd
- Lot 11 Marina Dr
- Lot 78 Oyster Point Dr
- 255 Oyster Point Dr
- 186 Goodman Dr
- 511 Goodman Dr
- 245 Youmans Rd
- 48 Salt Marsh Dr
- 0 Salt Marsh Dr
- 37 Salt Marsh Dr
- 37 Salt Marsh Dr
- 65 Yellow Bluff Rd
- 81 Salt Marsh Dr
- 49 Yellow Bluff Rd
- 57 Yellow Bluff Rd
- 0 Lot 17 Bermuda Bluff Rd Unit 264922
- 15 Salt Marsh Dr
- Lot68 Oyster Point Dr
- Lot 69 Oyster Point Dr
- 8 Oyster Point Dr Unit 8
- 10 Oyster Point Dr Unit 10
- Lot 65 Oyster Point Dr
- lot 79 Oyster Point Dr
- Lot 82 Oyster Point Dr
- 93 Salt Marsh Dr
- 99 Yellow Bluff Dr
- 19 Yellow Bluff Rd