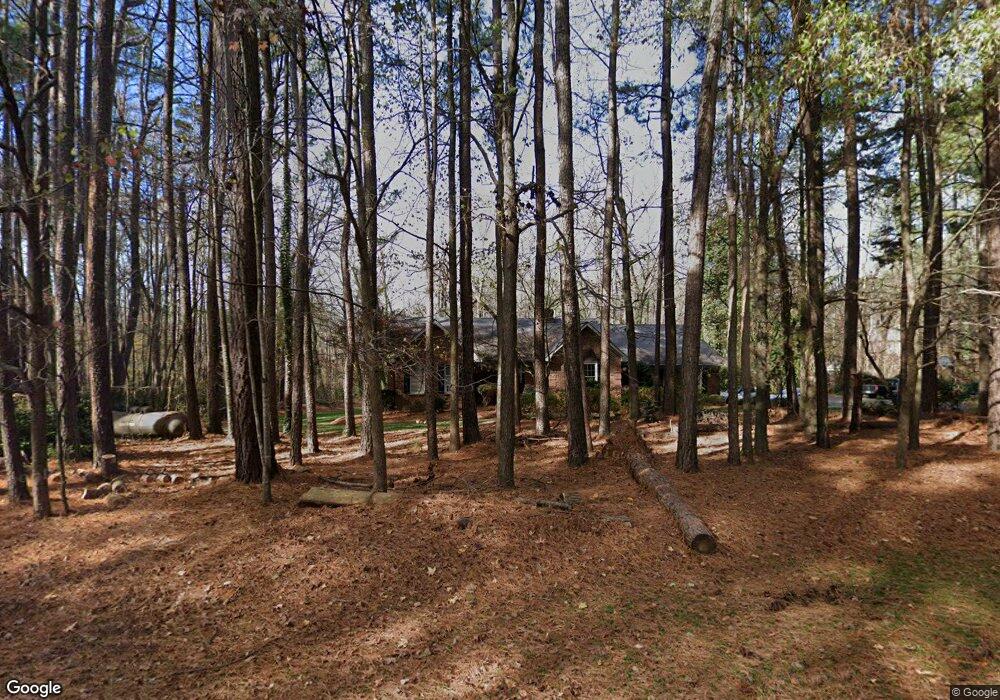
54 Scalybark Trail Concord, NC 28027
Estimated Value: $661,000 - $832,918
3
Beds
2
Baths
2,600
Sq Ft
$280/Sq Ft
Est. Value
About This Home
This home is located at 54 Scalybark Trail, Concord, NC 28027 and is currently estimated at $728,230, approximately $280 per square foot. 54 Scalybark Trail is a home located in Cabarrus County with nearby schools including W.R. Odell Elementary School, Harris Road Middle, and Cox Mill High School.
Ownership History
Date
Name
Owned For
Owner Type
Purchase Details
Closed on
Jan 21, 2005
Sold by
Tracy James P and Blackwelder Beth B
Bought by
Healey Patrick and Healey Virginia A
Current Estimated Value
Home Financials for this Owner
Home Financials are based on the most recent Mortgage that was taken out on this home.
Original Mortgage
$249,600
Outstanding Balance
$131,148
Interest Rate
6.37%
Mortgage Type
Purchase Money Mortgage
Estimated Equity
$597,082
Purchase Details
Closed on
Aug 25, 2000
Sold by
Blackwelder Beth B
Bought by
Tracy James P
Home Financials for this Owner
Home Financials are based on the most recent Mortgage that was taken out on this home.
Original Mortgage
$212,000
Interest Rate
8.07%
Mortgage Type
Purchase Money Mortgage
Purchase Details
Closed on
Feb 28, 2000
Sold by
Blackwelder Arthur L and Blackwelder Beth B
Bought by
Blackwelder Beth B
Purchase Details
Closed on
Dec 1, 1983
Create a Home Valuation Report for This Property
The Home Valuation Report is an in-depth analysis detailing your home's value as well as a comparison with similar homes in the area
Home Values in the Area
Average Home Value in this Area
Purchase History
| Date | Buyer | Sale Price | Title Company |
|---|---|---|---|
| Healey Patrick | $312,000 | -- | |
| Tracy James P | $265,000 | -- | |
| Blackwelder Beth B | -- | -- | |
| -- | $15,500 | -- |
Source: Public Records
Mortgage History
| Date | Status | Borrower | Loan Amount |
|---|---|---|---|
| Open | Healey Patrick | $249,600 | |
| Previous Owner | Tracy James P | $212,000 |
Source: Public Records
Tax History
| Year | Tax Paid | Tax Assessment Tax Assessment Total Assessment is a certain percentage of the fair market value that is determined by local assessors to be the total taxable value of land and additions on the property. | Land | Improvement |
|---|---|---|---|---|
| 2025 | $4,372 | $688,550 | $233,750 | $454,800 |
| 2024 | $4,372 | $688,550 | $233,750 | $454,800 |
| 2023 | $3,819 | $462,910 | $198,000 | $264,910 |
| 2022 | $3,740 | $462,910 | $198,000 | $264,910 |
| 2021 | $3,740 | $462,910 | $198,000 | $264,910 |
| 2020 | $3,740 | $462,910 | $198,000 | $264,910 |
| 2019 | $3,002 | $371,530 | $137,500 | $234,030 |
| 2018 | $2,928 | $371,530 | $137,500 | $234,030 |
| 2017 | $2,853 | $371,530 | $137,500 | $234,030 |
| 2016 | $2,853 | $346,700 | $129,250 | $217,450 |
| 2015 | $2,628 | $346,700 | $129,250 | $217,450 |
| 2014 | $2,628 | $346,700 | $129,250 | $217,450 |
Source: Public Records
Map
Nearby Homes
- 650 Downshire Rd NW
- 9879 Darby Creek Ave NW
- 618 Downshire Rd NW
- 614 Downshire Rd NW
- 9049 Treetop Way NW
- 8364 Ashvale St NW
- 8389 Ashvale St NW
- 8356 Ashvale St NW
- 695 Poplar View Dr
- 8375 Ashvale St NW
- 590 Nutgrove Dr NW
- 8353 Ashvale St NW
- 586 Nutgrove Dr NW
- 8550 Cottonwood Trail
- 8310 Ashvale St NW
- 9921 Oaklawn Blvd NW
- Tyler Plan at Annsborough Park - Signature Series
- The Fenmore Plan at Annsborough Park - Signature Series
- 488 Creevy Dr NW
- Juniper Plan at Annsborough Park - Signature Series
- 66 Scalybark Trail
- 8908 Bayberry Trail
- 46 Scalybark Trail
- 46 N Scalybark Trail
- 69 Scalybark Trail
- 8904 Bayberry Trail
- 53 Scalybark Trail
- 68 Quiet Cove
- 49 Scalybark Trail
- 8913 Bayberry Trail
- 45 Scalybark Trail
- 8901 Bayberry Trail
- 75 Scalybark Trail
- 8909 Bayberry Trail
- 56 Quiet Cove
- 69 Quiet Cove
- 78 N Scalybark Trail
- 52 Quiet Cove
- 65 Quiet Cove
- 8813 Bayberry Trail