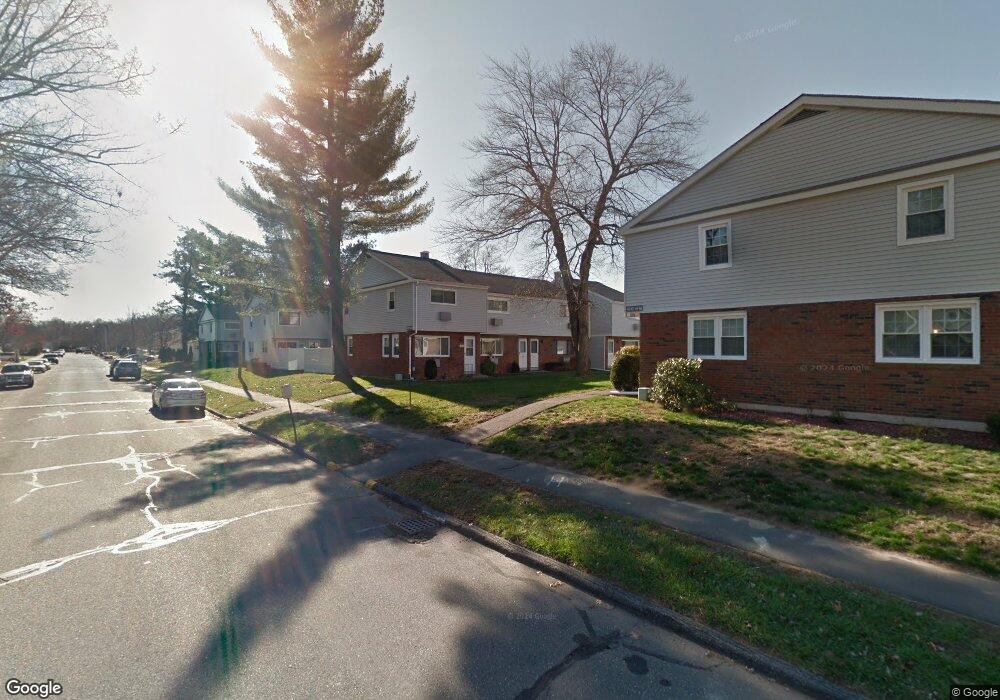
54 Sheri Ln Agawam, MA 01001
Estimated Value: $203,000 - $237,864
2
Beds
2
Baths
1,075
Sq Ft
$207/Sq Ft
Est. Value
About This Home
This home is located at 54 Sheri Ln, Agawam, MA 01001 and is currently estimated at $222,466, approximately $206 per square foot. 54 Sheri Ln is a home located in Hampden County with nearby schools including Agawam Junior High School, Agawam High School, and St Thomas The Apostle School.
Ownership History
Date
Name
Owned For
Owner Type
Purchase Details
Closed on
Jun 28, 2002
Sold by
Seymour Glenn F
Bought by
Khayev Viktor and Khayeva Velantina
Current Estimated Value
Home Financials for this Owner
Home Financials are based on the most recent Mortgage that was taken out on this home.
Original Mortgage
$70,300
Outstanding Balance
$30,245
Interest Rate
6.92%
Mortgage Type
Purchase Money Mortgage
Estimated Equity
$192,221
Purchase Details
Closed on
Oct 20, 1998
Sold by
Marciel Tracy K
Bought by
Seymour Glenn F
Home Financials for this Owner
Home Financials are based on the most recent Mortgage that was taken out on this home.
Original Mortgage
$62,155
Interest Rate
6.8%
Mortgage Type
Purchase Money Mortgage
Purchase Details
Closed on
Jul 29, 1988
Sold by
Hills Ridgeview
Bought by
Shay John P
Home Financials for this Owner
Home Financials are based on the most recent Mortgage that was taken out on this home.
Original Mortgage
$77,300
Interest Rate
10.39%
Mortgage Type
Purchase Money Mortgage
Create a Home Valuation Report for This Property
The Home Valuation Report is an in-depth analysis detailing your home's value as well as a comparison with similar homes in the area
Home Values in the Area
Average Home Value in this Area
Purchase History
| Date | Buyer | Sale Price | Title Company |
|---|---|---|---|
| Khayev Viktor | $74,000 | -- | |
| Seymour Glenn F | $64,900 | -- | |
| Shay John P | $85,900 | -- |
Source: Public Records
Mortgage History
| Date | Status | Borrower | Loan Amount |
|---|---|---|---|
| Open | Shay John P | $70,300 | |
| Previous Owner | Shay John P | $62,155 | |
| Previous Owner | Shay John P | $77,300 |
Source: Public Records
Tax History Compared to Growth
Tax History
| Year | Tax Paid | Tax Assessment Tax Assessment Total Assessment is a certain percentage of the fair market value that is determined by local assessors to be the total taxable value of land and additions on the property. | Land | Improvement |
|---|---|---|---|---|
| 2025 | $2,678 | $182,900 | $0 | $182,900 |
| 2024 | $2,659 | $182,900 | $0 | $182,900 |
| 2023 | $2,080 | $131,800 | $0 | $131,800 |
| 2022 | $1,920 | $119,200 | $0 | $119,200 |
| 2021 | $1,920 | $114,300 | $0 | $114,300 |
| 2020 | $1,895 | $112,600 | $0 | $112,600 |
| 2019 | $1,846 | $110,900 | $0 | $110,900 |
| 2018 | $1,849 | $111,300 | $0 | $111,300 |
| 2017 | $1,781 | $109,200 | $0 | $109,200 |
| 2016 | $1,709 | $105,600 | $0 | $105,600 |
| 2015 | $1,514 | $96,200 | $0 | $96,200 |
Source: Public Records
Map
Nearby Homes
- 66 Sheri Ln Unit 66
- 468 Springfield St
- 56 Taft St
- 64 Blairs Hill Rd
- 335-337 Springfield St
- 36-38 Rowley St
- 86 Willow Brook Dr
- 25 Damato Way
- 267 Rowley St
- 712 Cooper St
- lot A North St
- 354 Rowley St
- 138 Suffield St
- 94 Witheridge St
- 67 Colemore St
- 50 Howard St
- 7 Agnoli Place
- 190 Mill St
- 691 Mill St
- 51 Reed St