54 Terri Rd Lagrange, GA 30240
Estimated Value: $194,000 - $241,000
3
Beds
2
Baths
1,254
Sq Ft
$168/Sq Ft
Est. Value
About This Home
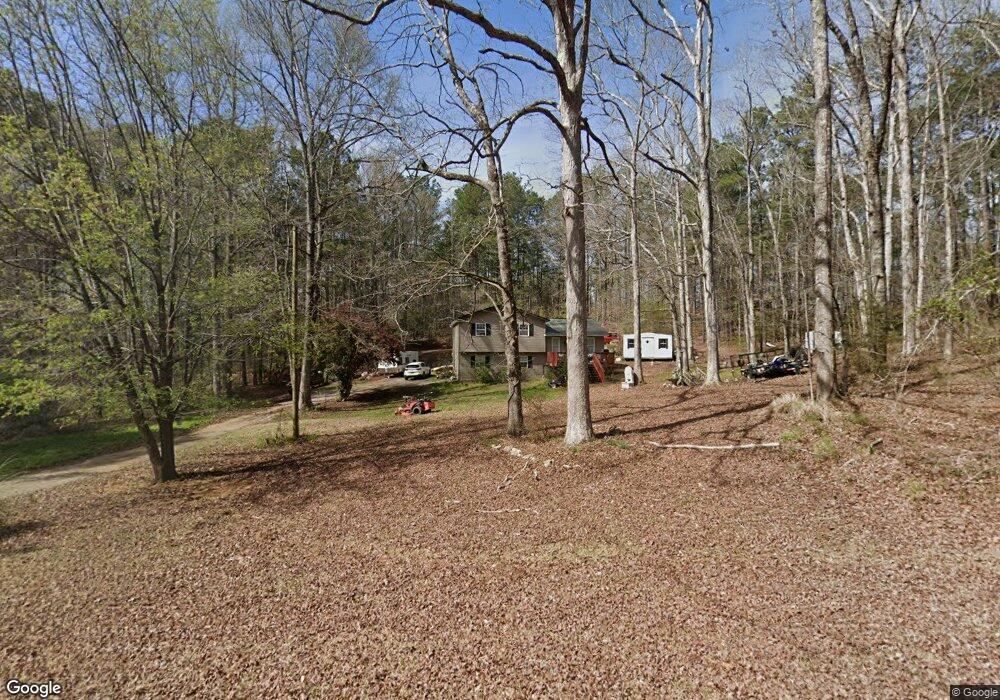
This home is located at 54 Terri Rd, Lagrange, GA 30240 and is currently estimated at $211,043, approximately $168 per square foot. 54 Terri Rd is a home located in Troup County with nearby schools including Ethel W. Kight Elementary School, Hollis Hand Elementary School, and Franklin Forest Elementary School.
Ownership History
Date
Name
Owned For
Owner Type
Purchase Details
Closed on
Feb 14, 2002
Sold by
Beth James and Beth Armstrong
Bought by
Armstrong James Steven
Current Estimated Value
Purchase Details
Closed on
May 26, 1994
Sold by
Dcr Holding
Bought by
Beth James and Beth Armstrong
Purchase Details
Closed on
May 1, 1994
Sold by
Secured Realty
Bought by
Dcr Holding
Purchase Details
Closed on
Oct 22, 1993
Sold by
Blizzard T E
Bought by
Secured Realty
Purchase Details
Closed on
Sep 1, 1993
Sold by
Dcrs Holding Inc
Bought by
Blizzard T E
Purchase Details
Closed on
Aug 13, 1993
Sold by
Std
Bought by
Dcrs Holding Inc
Purchase Details
Closed on
Aug 3, 1993
Sold by
Carl Cameron Et Al-By Agt
Bought by
Std
Purchase Details
Closed on
Mar 12, 1990
Bought by
Carl Cameron Et Al-By Agt
Purchase Details
Closed on
Sep 30, 1988
Create a Home Valuation Report for This Property
The Home Valuation Report is an in-depth analysis detailing your home's value as well as a comparison with similar homes in the area
Purchase History
| Date | Buyer | Sale Price | Title Company |
|---|---|---|---|
| Armstrong James Steven | -- | -- | |
| Beth James | $60,600 | -- | |
| Dcr Holding | $56,000 | -- | |
| Secured Realty | -- | -- | |
| Blizzard T E | -- | -- | |
| Dcrs Holding Inc | -- | -- | |
| Std | $43,000 | -- | |
| Carl Cameron Et Al-By Agt | -- | -- | |
| -- | $55,900 | -- | |
| -- | $55,900 | -- |
Source: Public Records
Tax History
| Year | Tax Paid | Tax Assessment Tax Assessment Total Assessment is a certain percentage of the fair market value that is determined by local assessors to be the total taxable value of land and additions on the property. | Land | Improvement |
|---|---|---|---|---|
| 2025 | $1,844 | $71,416 | $10,000 | $61,416 |
| 2024 | $1,753 | $66,264 | $10,000 | $56,264 |
| 2023 | $1,609 | $60,984 | $10,000 | $50,984 |
| 2022 | $1,539 | $57,144 | $8,000 | $49,144 |
| 2021 | $1,462 | $50,476 | $8,000 | $42,476 |
| 2020 | $1,459 | $50,364 | $5,480 | $44,884 |
| 2019 | $1,448 | $50,012 | $5,480 | $44,532 |
| 2018 | $1,325 | $45,924 | $5,480 | $40,444 |
| 2017 | $1,325 | $45,924 | $5,480 | $40,444 |
| 2016 | $1,363 | $47,167 | $5,500 | $41,667 |
| 2015 | $1,365 | $47,167 | $5,500 | $41,667 |
| 2014 | $1,249 | $43,249 | $5,500 | $37,749 |
| 2013 | -- | $40,621 | $5,500 | $35,121 |
Source: Public Records
Map
Nearby Homes
- 163 Terri Rd
- 15 Williams Ct
- 511 Williams Rd
- 524 Williams Rd
- 0 Leisure Cove Dr Unit 10619411
- 205 Long Cove Dr
- 108 Stonebridge Ln
- 42 Deer Pointe Ct
- 1100 County Road 442
- 780 Sharman Rd
- 153 N Whatley Rd
- 226 Linda Ln
- 104 Dogwood Point
- 213 Linda Ln
- 4004 White Oak Ln
- 709 Vernon Ferry Rd
- 201 Lakeview Ct
- 109 Riverbluff Dr
- 101 Riverbluff Dr
- 106 Landings Way
Your Personal Tour Guide
Ask me questions while you tour the home.