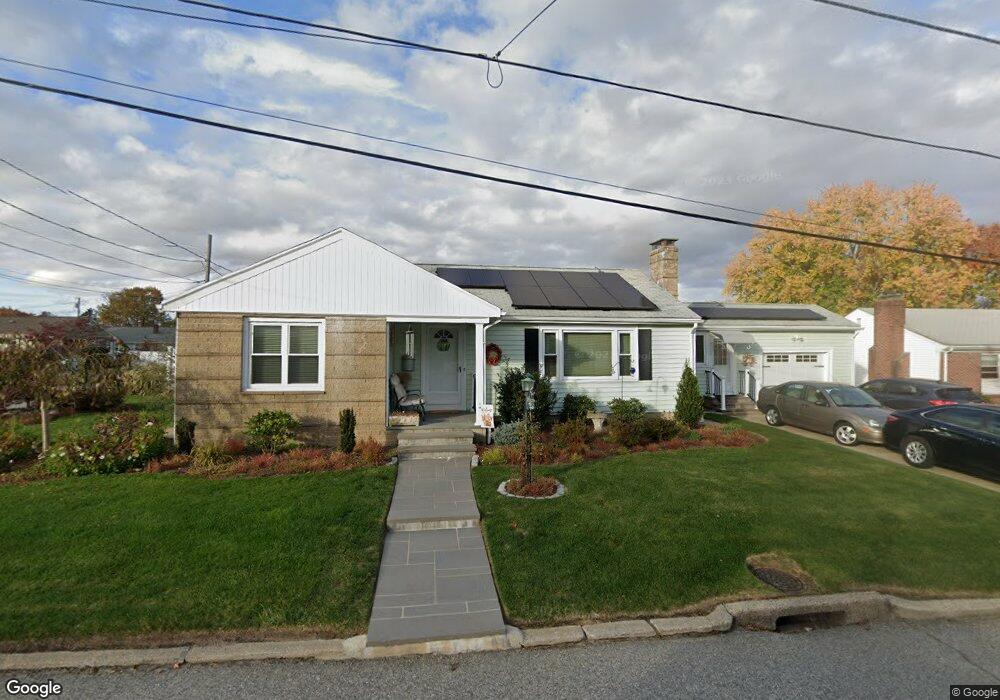
54 Tome St Cranston, RI 02920
Budlong NeighborhoodEstimated Value: $463,711 - $564,000
About This Home
This home is located at 54 Tome St, Cranston, RI 02920 and is currently estimated at $500,678, approximately $382 per square foot. 54 Tome St is a home located in Providence County with nearby schools including Woodridge Elementary School, Western Hills Middle School, and Cranston High School West.
Ownership History
We collect this data history from publicly available records. To have your information removed, we recommend requesting removal directly through your county’s website.
Purchase Details
Home Values in the Area
Average Home Value in this Area
Purchase History
We collect this data history from publicly available records. To have your information removed, we recommend requesting removal directly through your county’s website.
| Date | Buyer | Sale Price | Title Company |
|---|---|---|---|
| $117,000 | -- |
Mortgage History
We collect this data history from publicly available records. To have your information removed, we recommend requesting removal directly through your county’s website.
| Date | Status | Borrower | Loan Amount |
|---|---|---|---|
| Open | $100,000 | ||
| Open | $171,700 | ||
| Closed | $25,000 |
Tax History
We collect this data history from publicly available records. To have your information removed, we recommend requesting removal directly through your county’s website.
| Year | Tax Paid | Tax Assessment Tax Assessment Total Assessment is a certain percentage of the fair market value that is determined by local assessors to be the total taxable value of land and additions on the property. | Land | Improvement |
|---|---|---|---|---|
| 2025 | $4,794 | $345,400 | $112,500 | $232,900 |
| 2024 | $4,701 | $345,400 | $112,500 | $232,900 |
| 2023 | $4,508 | $238,500 | $74,000 | $164,500 |
| 2022 | $4,415 | $238,500 | $74,000 | $164,500 |
| 2021 | $4,293 | $238,500 | $74,000 | $164,500 |
| 2020 | $4,247 | $204,500 | $70,500 | $134,000 |
| 2019 | $4,247 | $204,500 | $70,500 | $134,000 |
| 2018 | $4,149 | $204,500 | $70,500 | $134,000 |
| 2017 | $4,076 | $177,700 | $63,500 | $114,200 |
| 2016 | $3,989 | $177,700 | $63,500 | $114,200 |
| 2015 | $3,989 | $177,700 | $63,500 | $114,200 |
| 2014 | $3,915 | $171,400 | $63,500 | $107,900 |
Map
- 26 Bernard St
- 34 Intervale Rd
- 39 Salem Ave
- 4 Eden Park Dr
- 21 Brookwood Rd
- 84 N View Ave
- 25 Plaza St
- 120 Bretton Woods Dr
- 28 Richland Rd
- 165 Salem Ave
- 131 Blackamore Ave
- 100 E View Ave
- 146 Lexington Ave
- 55 Stevens Rd
- 19 Griswold Ave
- 111 Waldron Ave
- 103 Oakland Ave
- 105 Shirley Blvd
- 24 Columbus Blvd
- 131 Fordson Ave Unit 4
Ask me questions while you tour the home.