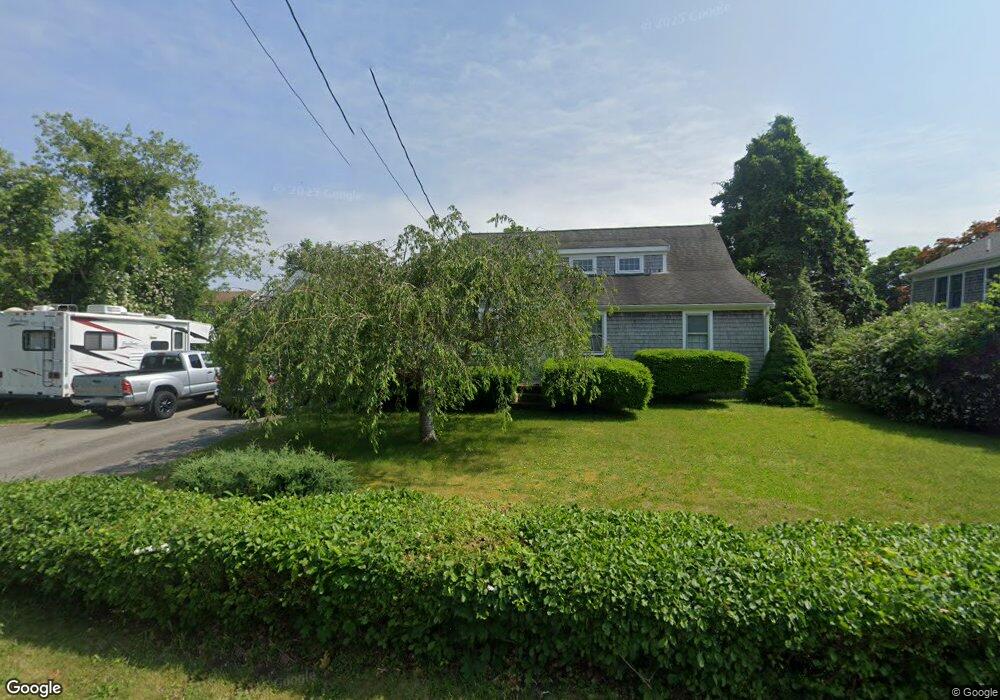
54 Town Neck Rd Sandwich, MA 02563
Estimated Value: $832,000 - $1,024,061
3
Beds
1
Bath
2,326
Sq Ft
$400/Sq Ft
Est. Value
About This Home
This home is located at 54 Town Neck Rd, Sandwich, MA 02563 and is currently estimated at $929,515, approximately $399 per square foot. 54 Town Neck Rd is a home located in Barnstable County with nearby schools including Sandwich Middle High School, Waldorf School of Cape Cod, and Bridgeview Montessori School.
Ownership History
Date
Name
Owned For
Owner Type
Purchase Details
Closed on
Mar 30, 2001
Sold by
Mcgarry Edward J and Mcgarry Michelle J
Bought by
Giampietro J1oseph F and Giampietro Elizabeth C
Current Estimated Value
Home Financials for this Owner
Home Financials are based on the most recent Mortgage that was taken out on this home.
Original Mortgage
$142,000
Outstanding Balance
$52,113
Interest Rate
6.96%
Mortgage Type
Purchase Money Mortgage
Estimated Equity
$877,402
Purchase Details
Closed on
Oct 30, 1997
Sold by
Copeland Frank H
Bought by
Mcgarry Edward J and Mcgarry Michaelle J
Home Financials for this Owner
Home Financials are based on the most recent Mortgage that was taken out on this home.
Original Mortgage
$97,092
Interest Rate
7.31%
Mortgage Type
Purchase Money Mortgage
Create a Home Valuation Report for This Property
The Home Valuation Report is an in-depth analysis detailing your home's value as well as a comparison with similar homes in the area
Home Values in the Area
Average Home Value in this Area
Purchase History
| Date | Buyer | Sale Price | Title Company |
|---|---|---|---|
| Giampietro J1oseph F | $182,000 | -- | |
| Mcgarry Edward J | $108,000 | -- |
Source: Public Records
Mortgage History
| Date | Status | Borrower | Loan Amount |
|---|---|---|---|
| Open | Giampietro J1oseph F | $142,000 | |
| Previous Owner | Mcgarry Edward J | $97,092 |
Source: Public Records
Tax History Compared to Growth
Tax History
| Year | Tax Paid | Tax Assessment Tax Assessment Total Assessment is a certain percentage of the fair market value that is determined by local assessors to be the total taxable value of land and additions on the property. | Land | Improvement |
|---|---|---|---|---|
| 2025 | $9,617 | $909,800 | $456,100 | $453,700 |
| 2024 | $8,445 | $781,900 | $340,700 | $441,200 |
| 2023 | $8,235 | $716,100 | $309,700 | $406,400 |
| 2022 | $7,593 | $577,000 | $248,900 | $328,100 |
| 2021 | $7,313 | $531,100 | $239,300 | $291,800 |
| 2020 | $6,295 | $439,900 | $218,600 | $221,300 |
| 2019 | $6,010 | $419,700 | $212,500 | $207,200 |
| 2018 | $5,502 | $385,000 | $192,900 | $192,100 |
| 2017 | $5,345 | $358,000 | $178,700 | $179,300 |
| 2016 | $5,091 | $351,800 | $176,900 | $174,900 |
| 2015 | $5,006 | $337,800 | $166,400 | $171,400 |
Source: Public Records
Map
Nearby Homes