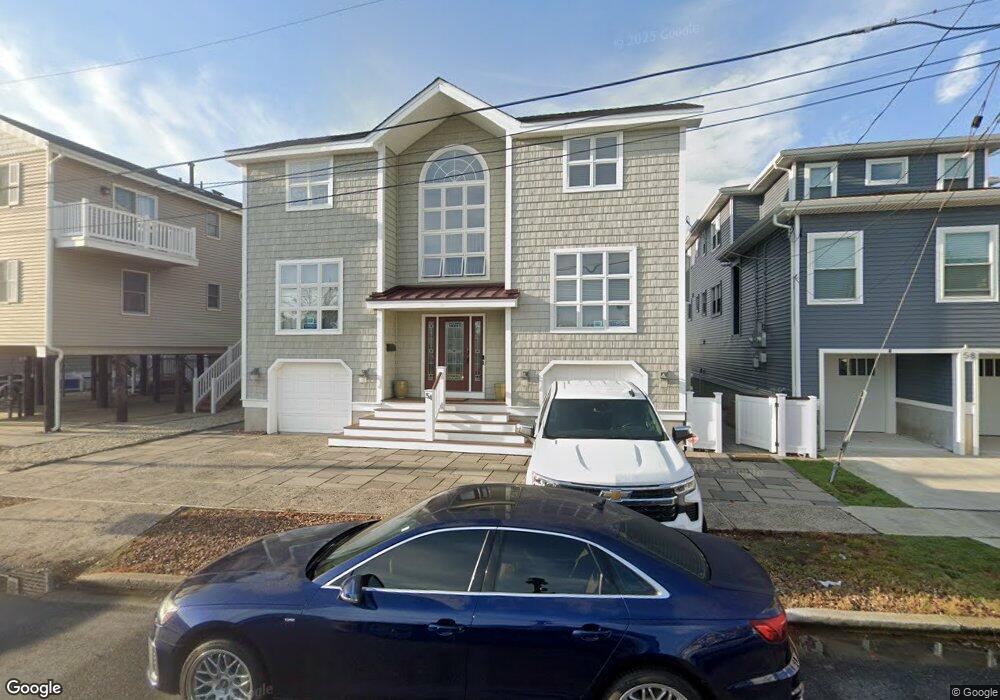
54 W 16th St Unit A Ocean City, NJ 08226
Estimated Value: $1,349,000 - $1,779,000
3
Beds
2
Baths
1,720
Sq Ft
$878/Sq Ft
Est. Value
About This Home
This home is located at 54 W 16th St Unit A, Ocean City, NJ 08226 and is currently estimated at $1,510,394, approximately $878 per square foot. 54 W 16th St Unit A is a home located in Cape May County with nearby schools including Ocean City Primary School, Ocean City Intermediate School, and Ocean City High School.
Ownership History
Date
Name
Owned For
Owner Type
Purchase Details
Closed on
Oct 5, 2010
Sold by
Yablon Jeffrey and Yablon Monique R
Bought by
Kolea James A and Kolea Amy L
Current Estimated Value
Home Financials for this Owner
Home Financials are based on the most recent Mortgage that was taken out on this home.
Original Mortgage
$84,500
Outstanding Balance
$56,148
Interest Rate
4.41%
Mortgage Type
Credit Line Revolving
Estimated Equity
$1,454,246
Purchase Details
Closed on
Sep 29, 2006
Sold by
Vanscyoc I Douglas and Vanscyoc Ann
Bought by
Yablon Jeffrey and Yablon Monique
Home Financials for this Owner
Home Financials are based on the most recent Mortgage that was taken out on this home.
Original Mortgage
$799,200
Interest Rate
6.37%
Mortgage Type
Purchase Money Mortgage
Create a Home Valuation Report for This Property
The Home Valuation Report is an in-depth analysis detailing your home's value as well as a comparison with similar homes in the area
Home Values in the Area
Average Home Value in this Area
Purchase History
| Date | Buyer | Sale Price | Title Company |
|---|---|---|---|
| Kolea James A | $627,199 | First American Title Ins Co | |
| Yablon Jeffrey | $999,999 | Independence Abstract & Titl |
Source: Public Records
Mortgage History
| Date | Status | Borrower | Loan Amount |
|---|---|---|---|
| Open | Kolea James A | $84,500 | |
| Open | Kolea James A | $417,000 | |
| Previous Owner | Yablon Jeffrey | $799,200 |
Source: Public Records
Tax History Compared to Growth
Tax History
| Year | Tax Paid | Tax Assessment Tax Assessment Total Assessment is a certain percentage of the fair market value that is determined by local assessors to be the total taxable value of land and additions on the property. | Land | Improvement |
|---|---|---|---|---|
| 2025 | $7,447 | $663,700 | $448,000 | $215,700 |
| 2024 | $7,447 | $663,700 | $448,000 | $215,700 |
| 2023 | $7,108 | $663,700 | $448,000 | $215,700 |
| 2022 | $6,829 | $663,700 | $448,000 | $215,700 |
| 2021 | $4,951 | $663,700 | $448,000 | $215,700 |
| 2020 | $6,491 | $663,700 | $448,000 | $215,700 |
| 2019 | $6,418 | $663,700 | $448,000 | $215,700 |
| 2018 | $6,358 | $663,700 | $448,000 | $215,700 |
| 2017 | $6,259 | $663,700 | $448,000 | $215,700 |
| 2016 | $6,020 | $663,700 | $448,000 | $215,700 |
| 2015 | $5,940 | $663,700 | $448,000 | $215,700 |
| 2014 | $5,854 | $663,700 | $448,000 | $215,700 |
Source: Public Records
Map
Nearby Homes
- 1612 Pleasure Ave Unit 1
- 133 W 17th St
- 170 W 17th St Unit 2
- 68 W 15th St
- 29 Sunset Place
- 195 W 17th St Unit 1
- 233 W 17th St
- 1416 Pleasure Ave
- 7 Bayview Place
- 1755 Bay Ave
- 43 W 14th St
- 19 W 14th St Unit 2
- 25 W 14th St Unit 1
- 1521 Haven Ave
- 18 E 14th St Unit 2
- 1755 Haven Ave Unit A
- 38 Arkansas Ave
- 1651 West Ave
- 1731 West Ave Unit 2
- 1738 Asbury Ave Unit 2
- 54 W 16th St Unit B
- 58 W 16th St Unit 2
- 58 W 16th St Unit 2nd Floor
- 58 W 16th St
- 58 W 16th St Unit B
- 50 W 16th St Unit 52
- 60 W 16th St Unit 62
- 48 W 16th St
- 46 W 16th St
- 64 W 16th St
- 44 W 16th St
- 1638 Pleasure Ave
- 42 W 16th St
- 1636 Pleasure Ave
- 40 W 16th St
- 1630 Pleasure Ave
- 1624 Pleasure Ave
- 69 W 16th St
- 77 W 16th St
- 38 W 16th St