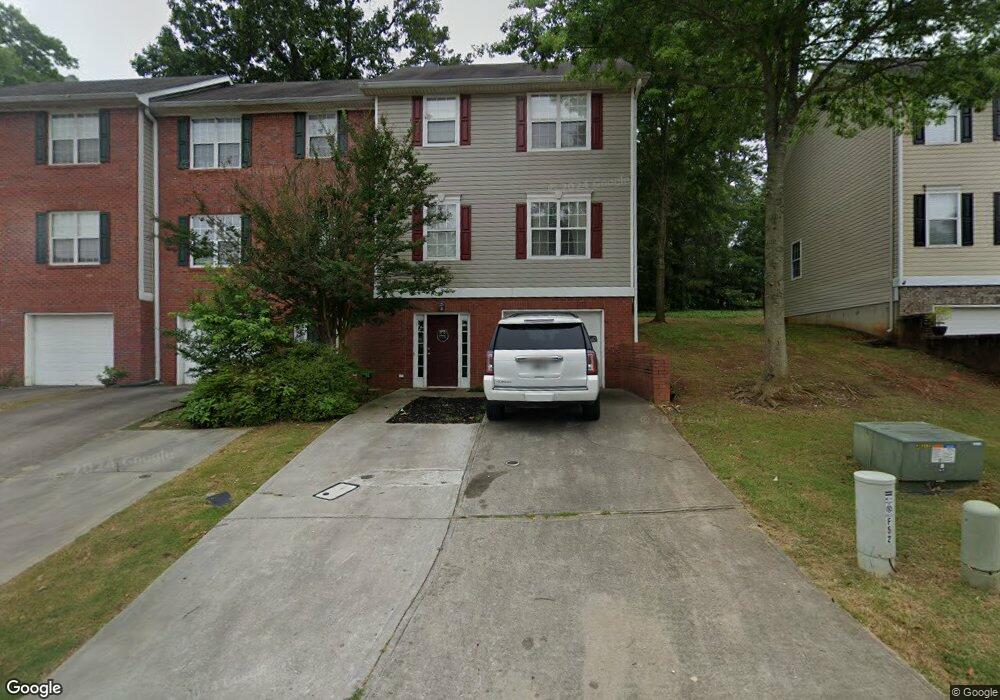
54 Westside Chase SW Cartersville, GA 30120
Estimated Value: $209,000 - $237,772
8
Beds
12
Baths
4,992
Sq Ft
$45/Sq Ft
Est. Value
About This Home
This home is located at 54 Westside Chase SW, Cartersville, GA 30120 and is currently estimated at $224,943, approximately $45 per square foot. 54 Westside Chase SW is a home located in Bartow County with nearby schools including Taylorsville Elementary School, Woodland Middle School, and Woodland High School.
Ownership History
Date
Name
Owned For
Owner Type
Purchase Details
Closed on
Mar 1, 2021
Sold by
Siniard Leslie J
Bought by
Sls Properties Llc
Current Estimated Value
Purchase Details
Closed on
Jan 4, 2019
Sold by
Reyes Properties Llc
Bought by
Siniard Leslie J
Home Financials for this Owner
Home Financials are based on the most recent Mortgage that was taken out on this home.
Original Mortgage
$78,750
Interest Rate
4.7%
Mortgage Type
New Conventional
Purchase Details
Closed on
May 21, 2015
Sold by
Roberts Tal David
Bought by
Reyes Properties Llc
Home Financials for this Owner
Home Financials are based on the most recent Mortgage that was taken out on this home.
Original Mortgage
$58,100
Interest Rate
3.77%
Mortgage Type
New Conventional
Purchase Details
Closed on
Oct 26, 2012
Sold by
Hall Robert K
Bought by
54 Westside Chase Llc
Create a Home Valuation Report for This Property
The Home Valuation Report is an in-depth analysis detailing your home's value as well as a comparison with similar homes in the area
Home Values in the Area
Average Home Value in this Area
Purchase History
| Date | Buyer | Sale Price | Title Company |
|---|---|---|---|
| Sls Properties Llc | -- | -- | |
| Siniard Leslie J | $105,000 | -- | |
| Reyes Properties Llc | -- | -- | |
| Roberts Tal David | $72,675 | -- | |
| 54 Westside Chase Llc | -- | -- |
Source: Public Records
Mortgage History
| Date | Status | Borrower | Loan Amount |
|---|---|---|---|
| Previous Owner | Siniard Leslie J | $78,750 | |
| Previous Owner | Roberts Tal David | $58,100 |
Source: Public Records
Tax History Compared to Growth
Tax History
| Year | Tax Paid | Tax Assessment Tax Assessment Total Assessment is a certain percentage of the fair market value that is determined by local assessors to be the total taxable value of land and additions on the property. | Land | Improvement |
|---|---|---|---|---|
| 2024 | $2,151 | $86,434 | $10,800 | $75,634 |
| 2023 | $2,100 | $80,043 | $10,800 | $69,243 |
| 2022 | $1,611 | $63,432 | $10,800 | $52,632 |
| 2021 | $1,289 | $48,314 | $10,800 | $37,514 |
| 2020 | $1,154 | $43,514 | $6,000 | $37,514 |
| 2019 | $1,057 | $38,065 | $4,000 | $34,065 |
| 2018 | $1,035 | $37,145 | $4,000 | $33,145 |
| 2017 | $1,040 | $37,145 | $4,000 | $33,145 |
| 2016 | $820 | $29,070 | $3,200 | $25,870 |
| 2015 | $718 | $25,400 | $3,200 | $22,200 |
| 2014 | -- | $25,400 | $3,200 | $22,200 |
| 2013 | -- | $18,280 | $3,200 | $15,080 |
Source: Public Records
Map
Nearby Homes
- 30 Meadowbridge Dr SW
- 25 Sequoyah Trail SW
- 520 Brown Farm Rd SW
- 700 Brown Farm Rd SW
- 52 Curtis Ct SW
- 18 Foxfire Ln SW
- 33 Engineer Ln SW
- 000 Lucas Rd SW
- 41 Fox Fire Ln SW
- 44 Seattle Slew Way
- 21 Whistle Stop Dr SW
- 264 Euharlee Rd SW
- 11 Vintage Ct SW
- 00 Cummings Rd SE
- 103 Hankins Dr SW
- 10 Tabasco Cat Ct
- 20 Greenwood Dr SW
- 17 Riverview Ct SE
- 32 Encore Ln
- The James Plan at The Stiles
- 54 Westside Chase SW Unit 54,56,58,60
- 50 Westside Chase SW Unit 50
- 46 Westside Chase SW
- 62 Westside Chase SW Unit 26
- 62 Westside Chase SW
- 62 Westside Chase SW Unit 62
- 53 Westside Chase SW
- 44 Westside Chase SW Unit 44
- 64 Westside Chase SW
- 57 Westside Chase SW
- 51 Westside Chase SW
- 49 Westside Chase SW
- 66 Westside Chase SW
- 68 Westside Chase SW
- 40 Westside Chase SW
- 45 Westside Chase SW
- 43 Westside Chase SW
- 41 Westside Chase SW
- 41 Westside Chase SW Unit 41
- 72 Westside Chase SW