Estimated Value: $126,000 - $185,000
3
Beds
2
Baths
3,282
Sq Ft
$50/Sq Ft
Est. Value
About This Home
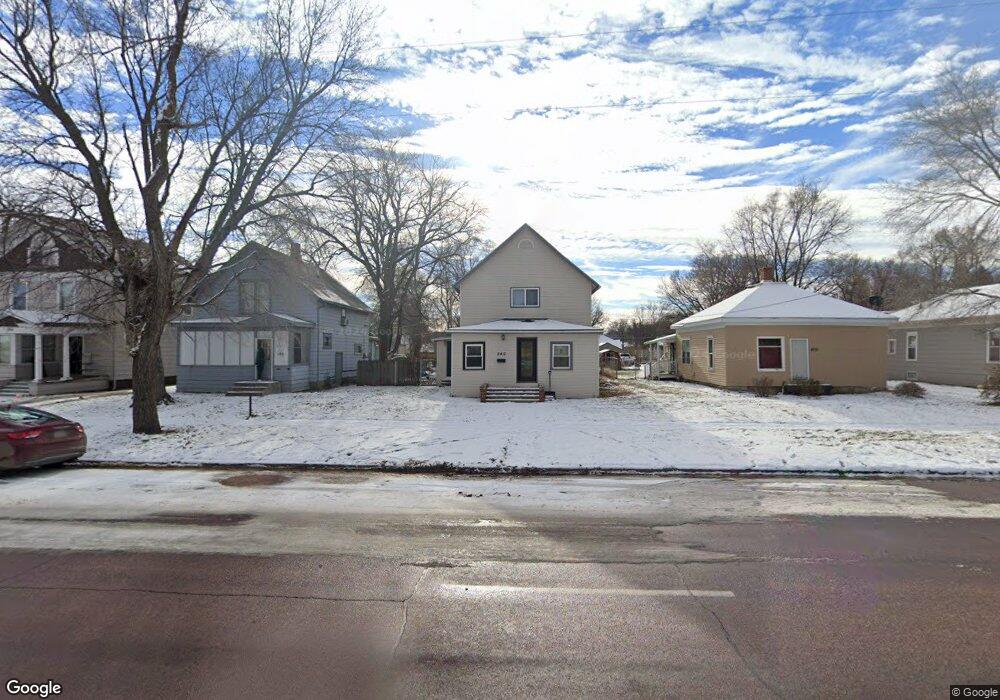
This home is located at 540 3rd St SE, Huron, SD 57350 and is currently estimated at $162,662, approximately $49 per square foot. 540 3rd St SE is a home with nearby schools including Huron High School, James Valley Christian School, and Holy Trinity Catholic Elementary School.
Ownership History
Date
Name
Owned For
Owner Type
Purchase Details
Closed on
Sep 20, 2019
Bought by
Holler Rachel
Current Estimated Value
Purchase Details
Closed on
Feb 16, 2016
Bought by
Schuyler Holtrop
Purchase Details
Closed on
Jun 26, 2009
Sold by
Federal National Mortgage Association
Bought by
Burkhart Derrick M
Home Financials for this Owner
Home Financials are based on the most recent Mortgage that was taken out on this home.
Original Mortgage
$75,000
Interest Rate
5.62%
Mortgage Type
New Conventional
Purchase Details
Closed on
Feb 9, 2009
Sold by
Frost Jeremey
Bought by
Suntrust Mortgage Inc
Purchase Details
Closed on
Sep 29, 2008
Sold by
Suntrust Mortgage Inc
Bought by
Federal National Mortgage Association
Purchase Details
Closed on
Jul 25, 2006
Sold by
Bentz John and Bentz Carol
Bought by
Frost Jeremey
Home Financials for this Owner
Home Financials are based on the most recent Mortgage that was taken out on this home.
Original Mortgage
$108,000
Interest Rate
6.85%
Mortgage Type
Stand Alone First
Create a Home Valuation Report for This Property
The Home Valuation Report is an in-depth analysis detailing your home's value as well as a comparison with similar homes in the area
Home Values in the Area
Average Home Value in this Area
Purchase History
| Date | Buyer | Sale Price | Title Company |
|---|---|---|---|
| Holler Rachel | $99,000 | -- | |
| Schuyler Holtrop | $84,000 | -- | |
| Burkhart Derrick M | -- | Huron Title | |
| Suntrust Mortgage Inc | $123,505 | -- | |
| Federal National Mortgage Association | -- | -- | |
| Frost Jeremey | -- | Huron Title |
Source: Public Records
Mortgage History
| Date | Status | Borrower | Loan Amount |
|---|---|---|---|
| Previous Owner | Burkhart Derrick M | $75,000 | |
| Previous Owner | Frost Jeremey | $108,000 |
Source: Public Records
Tax History
| Year | Tax Paid | Tax Assessment Tax Assessment Total Assessment is a certain percentage of the fair market value that is determined by local assessors to be the total taxable value of land and additions on the property. | Land | Improvement |
|---|---|---|---|---|
| 2025 | $2,228 | $148,715 | $3,875 | $144,840 |
| 2024 | $2,094 | $135,550 | $3,875 | $131,675 |
| 2023 | $1,901 | $103,440 | $3,875 | $99,565 |
| 2022 | $1,924 | $103,440 | $3,875 | $99,565 |
| 2021 | $1,907 | $103,440 | $3,875 | $99,565 |
| 2020 | $1,933 | $103,440 | $3,875 | $99,565 |
| 2019 | $1,639 | $103,440 | $3,875 | $99,565 |
| 2018 | -- | $86,584 | $3,875 | $82,709 |
| 2017 | -- | $76,342 | $3,875 | $72,467 |
| 2016 | -- | $72,891 | $3,875 | $69,016 |
| 2015 | -- | $72,891 | $3,875 | $69,016 |
| 2014 | -- | $72,891 | $3,875 | $69,016 |
| 2013 | -- | $72,891 | $3,875 | $69,016 |
Source: Public Records
Map
Nearby Homes
- 551 Kansas Ave SE
- 842 Utah Ave SE
- 132 7th St SE
- 821 Idaho Ave SE
- 931 Beach Ave SE
- 854 Kansas Ave SE
- 675 California Ave SW
- 979 4th St NE
- 678 Illinois Ave SW
- 963 Dakota Ave S
- 1171 Simmons Ave SE
- 1023 Dakota Ave S
- 545 Montana Ave SW
- 0 S Dakota 37
- 1472 Ohio Ave SW
- 1776 Idaho Ave SE
- 1729 Kansas Ave SE
- 740 Michigan Ave SW
- 1810 Kansas Ave
- 1836 Illinois Ave SW
- 528 3rd St SE
- 560 3rd St SE
- 508 3rd St SE
- 349 Frank Ave SE
- 348 Beach Ave SE
- 513 3rd St SE
- 358 Beach Ave SE
- 547 4th St SE
- 336 Frank Ave SE
- 529 4th St SE
- 620 3rd St SE
- 378 Beach Ave SE
- 634 3rd St SE
- 360 Frank Ave SE
- 370 Frank Ave SE
- 621 3rd St SE
- 361 Beach Ave SE
- 465 3rd St SE
- 347 Beach Ave SE
- 380 Frank Ave SE
Your Personal Tour Guide
Ask me questions while you tour the home.