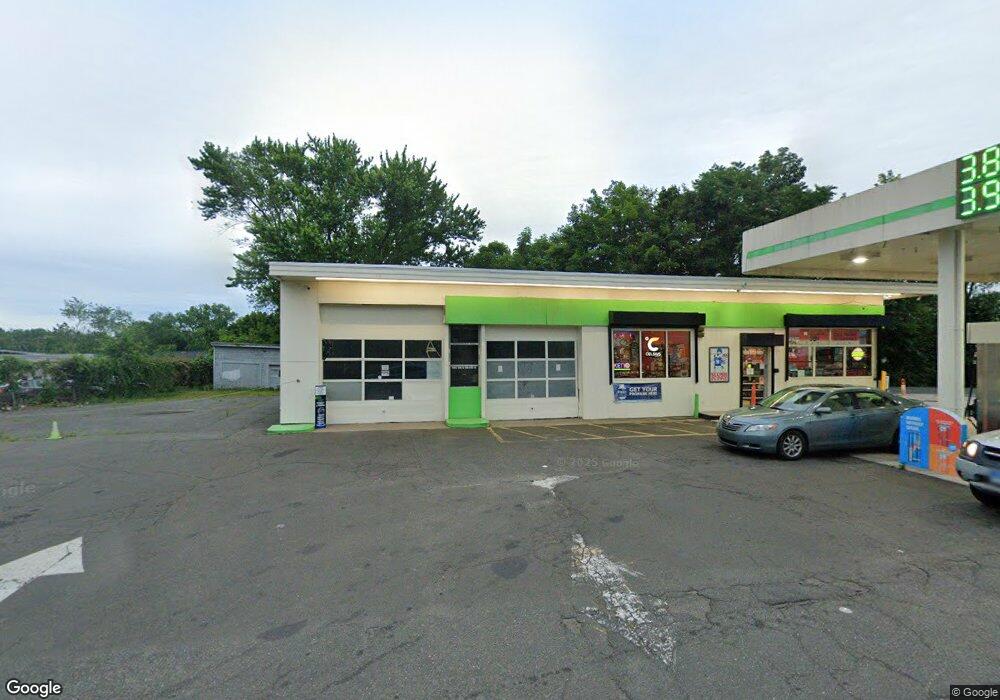
540 Boston Post Rd West Haven, CT 06516
Allingtown NeighborhoodEstimated Value: $420,011
Studio
--
Bath
2,100
Sq Ft
$200/Sq Ft
Est. Value
About This Home
This home is located at 540 Boston Post Rd, West Haven, CT 06516 and is currently estimated at $420,011, approximately $200 per square foot. 540 Boston Post Rd is a home located in New Haven County with nearby schools including Carrigan 5/6 Intermediate School, Harry M. Bailey Middle School, and West Haven High School.
Ownership History
Date
Name
Owned For
Owner Type
Purchase Details
Closed on
Dec 16, 2021
Sold by
Wawa Llc
Bought by
540 Bpr Llc
Current Estimated Value
Home Financials for this Owner
Home Financials are based on the most recent Mortgage that was taken out on this home.
Original Mortgage
$750,000
Outstanding Balance
$579,917
Interest Rate
3.11%
Mortgage Type
Stand Alone Refi Refinance Of Original Loan
Estimated Equity
-$159,906
Purchase Details
Closed on
Mar 21, 2006
Sold by
540 Orange Ave Llc
Bought by
Esposito Louis P
Create a Home Valuation Report for This Property
The Home Valuation Report is an in-depth analysis detailing your home's value as well as a comparison with similar homes in the area
Home Values in the Area
Average Home Value in this Area
Purchase History
| Date | Buyer | Sale Price | Title Company |
|---|---|---|---|
| 540 Bpr Llc | -- | None Available | |
| 540 Bpr Llc | -- | None Available | |
| Esposito Louis P | $277,000 | -- | |
| 540 Orange Ave Llc | $402,000 | -- | |
| Esposito Louis P | $277,000 | -- |
Source: Public Records
Mortgage History
| Date | Status | Borrower | Loan Amount |
|---|---|---|---|
| Open | 540 Bpr Llc | $750,000 | |
| Closed | 540 Bpr Llc | $750,000 | |
| Previous Owner | Esposito Louis P | $380,000 | |
| Previous Owner | Esposito Louis P | $60,000 |
Source: Public Records
Map
Nearby Homes
- 1 Rodney St
- 38 Chauncey St
- 194 Homeside Ave
- 15 Crest St Unit 27
- 47 Dix St
- 309 Terrace Ave Unit 44
- 49 Glade St Unit A4
- 28 Terrace Ave
- 57 Glade St Unit A1
- 45 Swampscott St
- 12 Collins Dr
- 148 Burwell Rd
- 33 Baggott St
- 880 First Ave
- 155 Lamson St
- 47,47R,63,65R Coleman St
- 897 1st Ave
- 70 Coleman St
- 127 Rangely St
- 23 Yates St
Your Personal Tour Guide
Ask me questions while you tour the home.