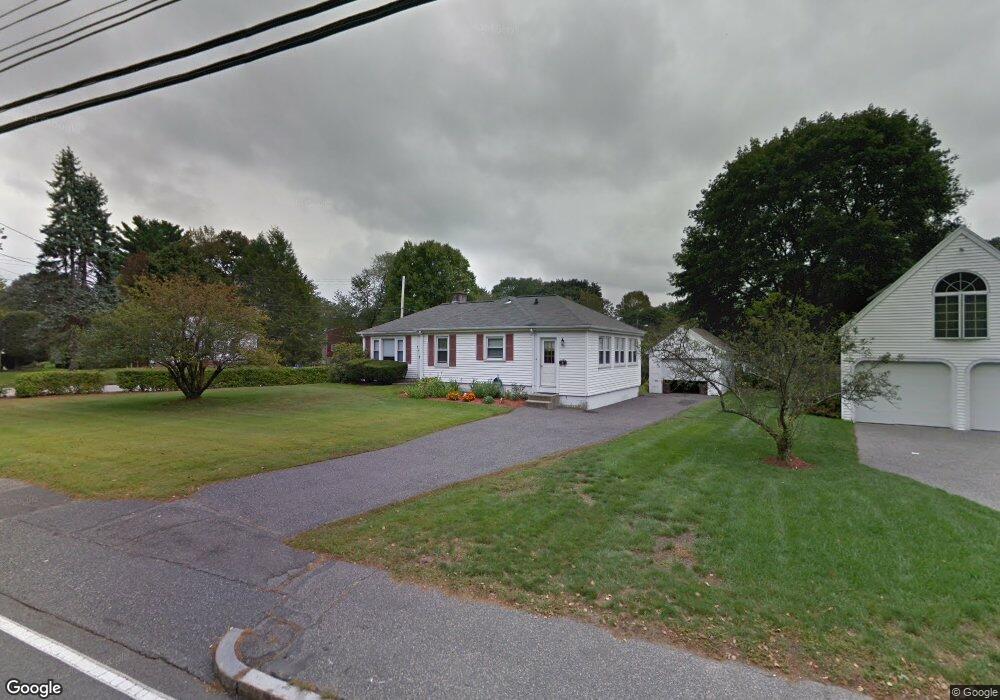
540 Brook St Framingham, MA 01701
Nobscot NeighborhoodEstimated Value: $504,660 - $589,000
2
Beds
1
Bath
909
Sq Ft
$599/Sq Ft
Est. Value
About This Home
This home is located at 540 Brook St, Framingham, MA 01701 and is currently estimated at $544,415, approximately $598 per square foot. 540 Brook St is a home located in Middlesex County with nearby schools including Framingham High School, Summit Montessori School, and Saint Bridget School.
Ownership History
Date
Name
Owned For
Owner Type
Purchase Details
Closed on
Aug 27, 2022
Sold by
Iodice Daniel and Iodice Teresa
Bought by
Daniel Q Iodice Ret and Iodice
Current Estimated Value
Purchase Details
Closed on
Nov 12, 2019
Sold by
Iodice Michael J and Iodice Francine G
Bought by
Iodice Daniel and Iodice Teresa
Purchase Details
Closed on
Oct 1, 1985
Bought by
Iodice Michael J and Iodice Francine G
Create a Home Valuation Report for This Property
The Home Valuation Report is an in-depth analysis detailing your home's value as well as a comparison with similar homes in the area
Home Values in the Area
Average Home Value in this Area
Purchase History
| Date | Buyer | Sale Price | Title Company |
|---|---|---|---|
| Daniel Q Iodice Ret | -- | None Available | |
| Daniel Q Iodice Ret | -- | None Available | |
| Iodice Daniel | $300,000 | -- | |
| Iodice Daniel | $300,000 | -- | |
| Iodice Michael J | $127,500 | -- |
Source: Public Records
Mortgage History
| Date | Status | Borrower | Loan Amount |
|---|---|---|---|
| Previous Owner | Iodice Michael J | $127,000 | |
| Previous Owner | Iodice Michael J | $125,000 |
Source: Public Records
Tax History
| Year | Tax Paid | Tax Assessment Tax Assessment Total Assessment is a certain percentage of the fair market value that is determined by local assessors to be the total taxable value of land and additions on the property. | Land | Improvement |
|---|---|---|---|---|
| 2025 | $5,929 | $496,600 | $263,000 | $233,600 |
| 2024 | $5,825 | $467,500 | $234,800 | $232,700 |
| 2023 | $5,538 | $423,100 | $209,600 | $213,500 |
| 2022 | $5,221 | $380,000 | $190,200 | $189,800 |
| 2021 | $5,083 | $361,800 | $182,800 | $179,000 |
| 2020 | $5,081 | $339,200 | $166,100 | $173,100 |
| 2019 | $5,011 | $325,800 | $166,100 | $159,700 |
| 2018 | $4,969 | $304,500 | $159,900 | $144,600 |
| 2017 | $4,853 | $290,400 | $155,300 | $135,100 |
| 2016 | $4,752 | $273,400 | $155,300 | $118,100 |
| 2015 | $4,505 | $252,800 | $155,300 | $97,500 |
Source: Public Records
Map
Nearby Homes
- 472 Brook St
- 484 Edgell Rd
- 46 Perry Henderson Dr
- 32 Lyman Rd
- 2 Grove St
- 576 Grove St
- 55 Pleasant St
- 179 Pleasant St
- 7 Little Tree Ln
- 915 Edgell Rd Unit 61
- 10 Main St Unit 507
- 401 Belknap Rd
- 13 Berkeley Rd
- 10 Bellwood Way
- 107 Lockland Ave
- 14 Ridgefield Dr
- 46 Brookfield Cir
- 231 Central St
- 1186 Worcester Rd Unit 610
- 14 Callahan Dr Unit 14
Your Personal Tour Guide
Ask me questions while you tour the home.