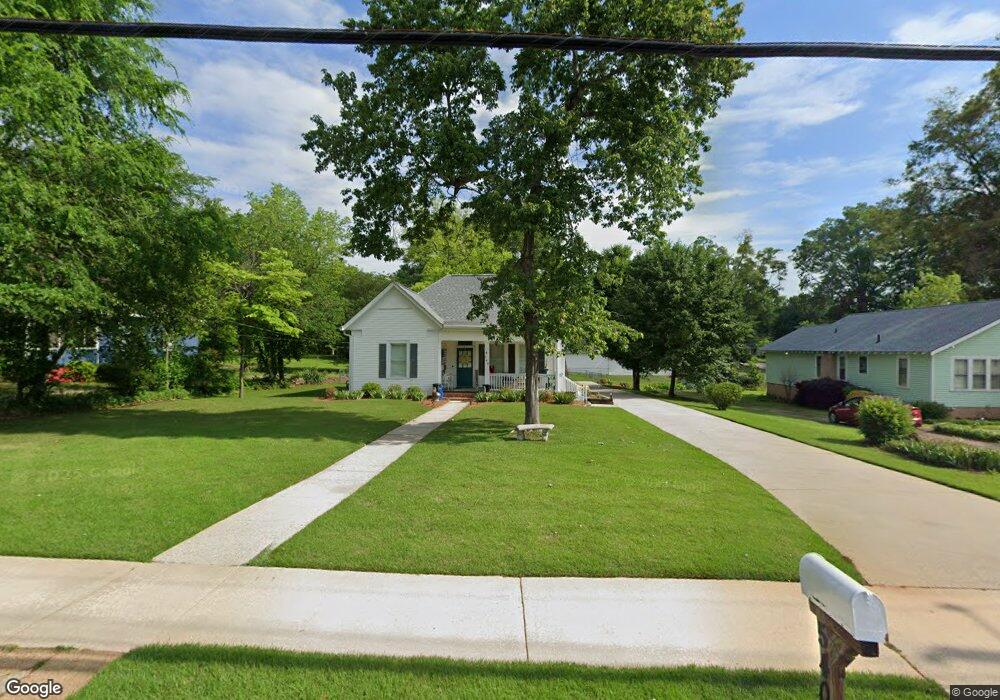
540 Cedar St Carrollton, GA 30117
Estimated Value: $306,799 - $350,000
2
Beds
2
Baths
1,618
Sq Ft
$203/Sq Ft
Est. Value
About This Home
This home is located at 540 Cedar St, Carrollton, GA 30117 and is currently estimated at $327,700, approximately $202 per square foot. 540 Cedar St is a home located in Carroll County with nearby schools including Carrollton Elementary School, Carrollton Upper Elementary School, and Carrollton Middle School.
Ownership History
Date
Name
Owned For
Owner Type
Purchase Details
Closed on
Mar 17, 2017
Sold by
Harris Richard W
Bought by
Treadwell Parrish Christian
Current Estimated Value
Purchase Details
Closed on
Apr 27, 2010
Sold by
Campbell Bethany Rose
Bought by
Harris April B
Home Financials for this Owner
Home Financials are based on the most recent Mortgage that was taken out on this home.
Original Mortgage
$124,694
Interest Rate
4.75%
Mortgage Type
FHA
Purchase Details
Closed on
Apr 14, 2010
Sold by
Campbell Bethany Rose
Bought by
Harris April B
Home Financials for this Owner
Home Financials are based on the most recent Mortgage that was taken out on this home.
Original Mortgage
$124,694
Interest Rate
4.75%
Mortgage Type
FHA
Purchase Details
Closed on
Nov 12, 1998
Sold by
Kaylor
Bought by
Kaylor Jane S
Purchase Details
Closed on
Aug 7, 1990
Bought by
Kaylor
Create a Home Valuation Report for This Property
The Home Valuation Report is an in-depth analysis detailing your home's value as well as a comparison with similar homes in the area
Home Values in the Area
Average Home Value in this Area
Purchase History
| Date | Buyer | Sale Price | Title Company |
|---|---|---|---|
| Treadwell Parrish Christian | $159,500 | -- | |
| Harris April B | $127,000 | -- | |
| Harris April B | $127,000 | -- | |
| Kaylor Jane S | -- | -- | |
| Kaylor | $49,000 | -- |
Source: Public Records
Mortgage History
| Date | Status | Borrower | Loan Amount |
|---|---|---|---|
| Previous Owner | Harris April B | $124,694 | |
| Previous Owner | Harris April B | $124,694 |
Source: Public Records
Tax History Compared to Growth
Tax History
| Year | Tax Paid | Tax Assessment Tax Assessment Total Assessment is a certain percentage of the fair market value that is determined by local assessors to be the total taxable value of land and additions on the property. | Land | Improvement |
|---|---|---|---|---|
| 2024 | $2,706 | $112,654 | $27,434 | $85,220 |
| 2023 | $2,706 | $105,051 | $27,434 | $77,617 |
| 2022 | $2,217 | $84,343 | $18,289 | $66,054 |
| 2021 | $1,898 | $70,441 | $13,548 | $56,893 |
| 2020 | $1,745 | $63,730 | $13,548 | $50,182 |
| 2019 | $1,572 | $53,292 | $13,548 | $39,744 |
| 2018 | $1,451 | $48,485 | $13,548 | $34,937 |
| 2017 | $1,065 | $39,392 | $13,548 | $25,844 |
| 2016 | $1,071 | $39,392 | $13,548 | $25,844 |
| 2015 | $1,372 | $48,417 | $10,641 | $37,777 |
| 2014 | $1,378 | $48,418 | $10,641 | $37,777 |
Source: Public Records
Map
Nearby Homes
- 120 Stewart St
- 201 Stewart St
- 322 Cedar St
- 119 Oxford Square
- 122 Mandeville Ave
- 541 N White St Unit 12
- 541 N White St
- 114 Bennett Cir
- 123 Autumn Glen Dr
- 777 College St
- 114 Green Point Way
- 406 Harmon Ave
- 110 Town Walk Ln
- 123 Cedar Park Way
- 0 Ward St Unit 10390499
- 205 Johnson Ave Unit 231
- 103 W Chandler St
- 325 Almon Rd
- 301 C4 Bradley St
- 301 Bradley St