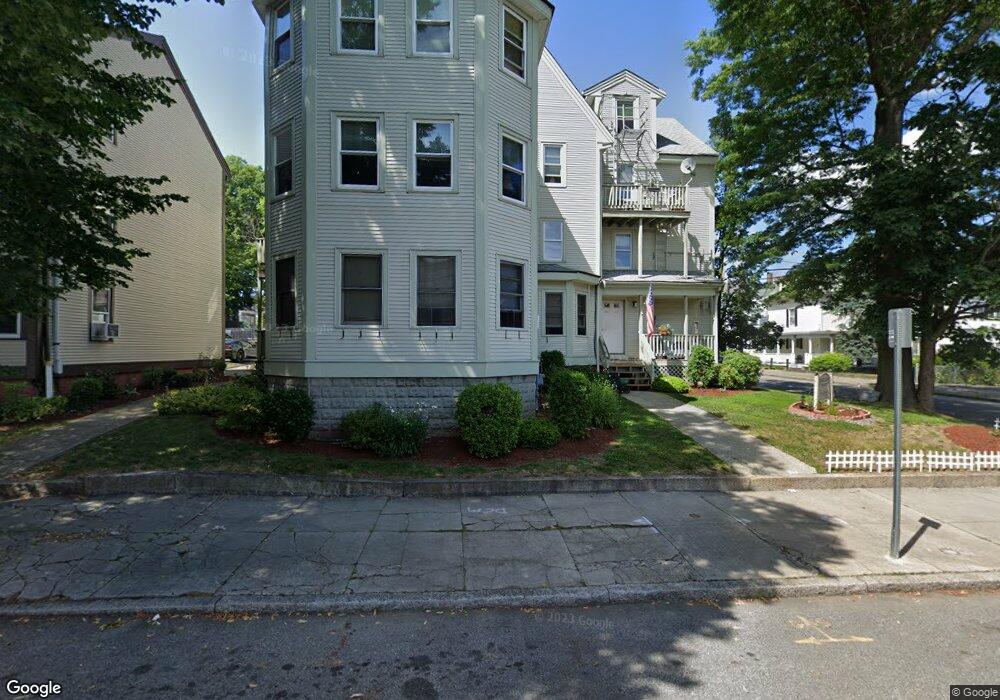
540 Cherry St Unit 2 Fall River, MA 02720
Bank Street NeighborhoodEstimated Value: $179,774 - $282,000
1
Bed
1
Bath
470
Sq Ft
$488/Sq Ft
Est. Value
About This Home
This home is located at 540 Cherry St Unit 2, Fall River, MA 02720 and is currently estimated at $229,444, approximately $488 per square foot. 540 Cherry St Unit 2 is a home located in Bristol County with nearby schools including Mary Fonseca Elementary School, Morton Middle School, and B M C Durfee High School.
Ownership History
Date
Name
Owned For
Owner Type
Purchase Details
Closed on
Dec 13, 2021
Sold by
Arruda Carlos M
Bought by
Hebert Katherine L
Current Estimated Value
Home Financials for this Owner
Home Financials are based on the most recent Mortgage that was taken out on this home.
Original Mortgage
$145,000
Outstanding Balance
$132,868
Interest Rate
3.14%
Mortgage Type
Purchase Money Mortgage
Estimated Equity
$96,576
Purchase Details
Closed on
Dec 12, 2001
Sold by
T&C Realty Inc
Bought by
Arruda Carlos Ml
Purchase Details
Closed on
May 22, 1991
Sold by
Rothwell Jeffrey P
Bought by
Bk Of Fall River
Purchase Details
Closed on
Aug 8, 1989
Sold by
J&E Rt
Bought by
Rothwell Jeffrey P
Home Financials for this Owner
Home Financials are based on the most recent Mortgage that was taken out on this home.
Original Mortgage
$47,250
Interest Rate
10%
Mortgage Type
Purchase Money Mortgage
Create a Home Valuation Report for This Property
The Home Valuation Report is an in-depth analysis detailing your home's value as well as a comparison with similar homes in the area
Home Values in the Area
Average Home Value in this Area
Purchase History
| Date | Buyer | Sale Price | Title Company |
|---|---|---|---|
| Hebert Katherine L | $165,000 | None Available | |
| Arruda Carlos Ml | $20,000 | -- | |
| Arruda Carlos Ml | $20,000 | -- | |
| Bk Of Fall River | $47,000 | -- | |
| Bk Of Fall River | $47,000 | -- | |
| Rothwell Jeffrey P | $47,250 | -- | |
| Rothwell Jeffrey P | $47,250 | -- |
Source: Public Records
Mortgage History
| Date | Status | Borrower | Loan Amount |
|---|---|---|---|
| Open | Hebert Katherine L | $145,000 | |
| Previous Owner | Rothwell Jeffrey P | $47,250 |
Source: Public Records
Tax History
| Year | Tax Paid | Tax Assessment Tax Assessment Total Assessment is a certain percentage of the fair market value that is determined by local assessors to be the total taxable value of land and additions on the property. | Land | Improvement |
|---|---|---|---|---|
| 2025 | $1,387 | $121,100 | $0 | $121,100 |
| 2024 | $1,219 | $106,100 | $0 | $106,100 |
| 2023 | $912 | $74,300 | $0 | $74,300 |
| 2022 | $904 | $68,800 | $0 | $68,800 |
| 2021 | $904 | $65,400 | $0 | $65,400 |
| 2020 | $802 | $55,500 | $0 | $55,500 |
| 2019 | $780 | $53,500 | $0 | $53,500 |
| 2018 | $640 | $43,800 | $0 | $43,800 |
| 2017 | $781 | $55,800 | $0 | $55,800 |
| 2016 | $740 | $54,300 | $0 | $54,300 |
| 2015 | $765 | $58,500 | $0 | $58,500 |
| 2014 | $793 | $63,000 | $0 | $63,000 |
Source: Public Records
Map
Nearby Homes
- 528 Cherry St Unit 3
- 501 Pine St
- 631 Walnut St
- 610 Walnut St
- 104 Oak St
- 360 High St
- 233 Franklin St
- 229 Franklin St
- 89 Oak St
- 464 Bank St Unit 10
- 499 Maple St
- 511 Bank St
- 275 Bank St
- 150 Purchase St
- 450 Rock St Unit 1
- 126 June St
- 243 Robeson St Unit 6
- 243 Robeson St Unit 3
- 862 Locust St
- 273 Tremont St
- 540 Cherry St Unit 8
- 540 Cherry St Unit 7
- 540 Cherry St Unit 6
- 540 Cherry St Unit 5
- 540 Cherry St Unit 4
- 540 Cherry St Unit 3
- 540 Cherry St Unit 1
- 544 Cherry St
- 528 Cherry St
- 528 Cherry St Unit 6
- 528 Cherry St Unit 5
- 528 Cherry St Unit 4
- 528 Cherry St Unit 2
- 528 Cherry St Unit 1
- 144 Grove Street U:6 Unit 6
- 144 Grove St Unit 7
- 144 Grove St Unit 6
- 144 Grove St Unit 5
- 144 Grove St Unit 4
- 144 Grove St Unit 3
Your Personal Tour Guide
Ask me questions while you tour the home.